The United States intends to impose new tariffs in the near future, which could affect dozens of countries. This was confirmed by US Trade Representative Jamison Greer, according to France24.
“We expect certain measures to be taken shortly,” he told CNBC, without specifying a timeframe.
The new tariffs, prepared by the Trump administration, will target 60 trading partners, and are set to be justified on the grounds of inaction in combating forced labour.
In February 2026, the US President imposed a 10% global tariff after the Supreme Court overturned a number of his tariffs. However, this measure is due to expire on 24 July. Analysts expect it to be replaced by new tariffs, linked to forced labour issues, ranging from 10 to 12.5%.
Since 22 July this year, the United States has imposed a 25% tariff on certain goods from Brazil. Furthermore, on 20 July, Trump announced the imposition of a 50% tariff on a wide range of imports from Canada worth nearly $20 billion.
As reported by Reuters, this move was announced in response to what the US administration described as discriminatory treatment of American-made cars, alcohol and dairy products. The tariffs are due to come into force 30 days after the proclamations are signed, i.e. on 19 August this year.
In this instance, Trump invoked Section 338 of the Tariff Act of 1930, which allows the president to impose punitive tariffs of up to 50% against trading partners that discriminate against US goods. This marked the first known application of this law in nearly a century of its existence.
The following day, Canadian Prime Minister Mark Carney stated that he was considering all options, adding that he and Trump had agreed to intensify discussions on a possible agreement over the coming weeks.
Meanwhile, on 21 July, the US and Mexico began a third round of bilateral talks to try to renegotiate the USMCA – Canada is not taking part in these talks. This is the first official discussion of changes to the agreement between the US, Mexico and Canada since the Trump administration refused to extend the regional trade pact on 1 July.
It should be noted that the United States has exempted Brazilian pig iron from the 25% additional duty. This decision demonstrates the significant dependence of American steelmakers on imports. The Office of the US Trade Representative (USTR) explained that over 95% of domestic production of merchant pig iron in the US is consumed by integrated steelworks. As a result, foundries and manufacturers using electric arc furnaces are in urgent need of foreign supplies.
https://gmk.center/en/news/the-us-is-preparing-new-tariffs-for-dozens-of-trading-partners/amp/
Adam Gabbatt
Trump’s response to the Iran war’s mounting death toll and astronomical costs? ‘It won’t have any impact on me’
Wed 22 Jul 2026 18.37 BSTShare

Could it be … that Donald Trump isn’t a team player?
The midterm elections are less than four months away, and Republicans in the House and the Senate – hampered by a deeply unpopular president and what might be an even less popular war – are increasingly fearful of losing their jobs. Even Trump’s base is beginning to turn against the conflict.
Yet asked on Tuesday if Iran is trying to affect the midterm elections by threatening the strait of Hormuz, the Republicans’ de facto leader was pretty blase.
“Probably. It won’t have any impact on me. I’m just going to do the right thing. I don’t view it as: ‘Gee, we’re having an election in a period of time.’ You know, everyone says: ‘Oh, I’m doing something before’ – no. The election – I can’t think about that having to do with this,” Trump said.
He added: “I think people are very impressed.”
Unfortunately for Trump – and for Republicans in swing districts – all available evidence suggests people are very unimpressed with the president’s nearly five-month war in Iran.
Just 28% of Americans think the Iran war is worth fighting, a Washington Post-Ipsos poll found last week; 68% believe it is not worth fighting. The same survey found that 29% of people believe “America’s leadership in the world has gotten stronger” under Trump; 52% think it has weakened.
Amid surging prices linked to the Iran war, just 17% of Americans said they were better off financially than they were when Trump became president.
Even Trump’s most hardcore supporters – the ones who heckle journalists at his rallies and wear T-shirts that say things like “Stomp my flag [and] I’ll stomp your ass” – are souring on the war.
About 37% of self-identified Maga Trump voters say the US should continue the war in Iran only if it doesn’t increase costs, according to a Politico pollreleased on Wednesday. Moreover, 57% of voters who self-identify as Maga blame the war in Iran for the increase in gas prices.
It is Not Good News, in other words, and this week some Fox News pundits issued urgent warnings to Trump to end the war.
“With the midterm elections a little more than 100 days away, the clock is ticking for President Trump to get out of this war before voters head to the polls. It’s making a lot of Republicans nervous. It’s already, as we know, unpopular,” Laura Ingraham, usually a staunch Trump supporter, said on her show on Monday.
“Republicans cannot let this become an endless distraction, especially if they want to win in November.”
With no clear exit strategy, news of mounting injuries and more deaths of service members, there are good reasons for voters to focus on the war. And then there is the financial cost.
During a contentious Senate hearing on Tuesday, the defense secretary, Pete Hegseth – he of alleged strip club stage-storming fame – said the Iran war had cost $37.5bn so far, as he asked Congress to approve an $88bn supplemental funding request. With gas prices running at more than $4 a gallon – up from about $3 when Trump took office – the spiraling costs are hardly likely to be a vote-winner.
It might be making Republicans in Congress nervous. But Trump, a president in his second term who is not eligible to run for re-election, arguably has less to lose. A Democratic-majority House could impeach him for the third time, but the Senate would be highly unlikely to convict. Whenever and however Trump leaves the White House, his landing will probably be softened by his soaring personal wealth – his income last year was $2.2bn.
With a president embroiled in a costly war, and seemingly ambivalent about how it affects his colleagues, could the midterms be a disaster? Maybe. Would Trump get over that? Probably.
https://www.theguardian.com/us-news/2026/jul/22/trump-iran-war-unpopular-expensive
July 22 (Reuters) - India's Hindustan Petroleum Corp (HPCL) on Wednesday reported a quarterly loss for the first time since the three months ended September 2022 as a sharp spike in crude prices weighed on profitability.
Here are details from the state-run company's earnings report:
• The state-run refiner posted a net loss of 115.26 billion rupees ($1.19 billion) for the first quarter, against a profit of 43.71 billion rupees a year ago.
• Average global Brent crude oil prices were about 45% higher than in the year-ago quarter due to the Middle East conflict, dragging marketing margins of oil marketing companies as they were forced to sell fuel below cost.
• Marketing margins on petrol and diesel averaged negative 10.6 rupees/litre and negative 18.4 rupees per litre during the quarter, according to analysts at Jefferies.
• HPCL's total expenses jumped 42.7% to 1.64 trillion rupees, with cost of raw materials consumed surging 74%.
• Fuel demand weakened in India, the world's third-largest importer and consumer of oil, with consumption declining 4.6%, 6.5%, and 3.1% year-on-year in April, May, and June, respectively.
• The firm's sale of products rose about 21% to 1.45 trillion rupees, helped by a compensation worth 19.80 billion rupees from the government for losses in the liquefied petroleum gas segment.
• Earlier in the day, peer BPCL also reported its first quarterly loss in 15 on higher crude costs.
($1 = 96.5650 Indian rupees)
(Reporting by Anuran Sadhu in Bengaluru; Editing by Harikrishnan Nair and Janane Venkatraman)
https://sg.finance.yahoo.com/news/indias-hpcl-posts-first-quarterly-122406102.html
KEY POINTS
Oil prices rose Wednesday after President Donald Trump threatened again to bomb Iranian bridges and power plants and Secretary of State Marco Rubio said Tehran was not serious about reaching a deal to end the fighting.
Brent crude futures , the international benchmark, traded about 3% higher at $93.74. U.S. West Texas Intermediate crude futures were up 2.6% to $86.53.
Speaking to reporters at a meeting of foreign ministers of the Association of Southeast Asian Nations in the Philippines on Wednesday, Rubio said Washington remains willing to negotiate an end to the war.
"The U.S. would love to reach a diplomatic settlement, we'd love to reach an agreement if it were possible with Iran," Rubio said. But the Iranians "don't seem to be serious" about making a deal, he said.
Tehran made commitments in the memorandum of understanding reached last month and "within two weeks violated it," Rubio said. U.S. forces will continue to defend transit through Hormuz, Rubio said.
"We're going to continue to protect shipping, we think other countries should join us in that endeavor," he said. "The president has many options available to him if they continue to insist on not being cooperative."
Iran's Houthis allies in Yemen, meanwhile, have declared an embargo against ships that deliver or load cargo at ports in Saudi Arabia. The embargo threatens Saudi oil exports that have been rerouted to the Red Sea to compensate for the loss of supplies through Hormuz.
Trump threatens bridges, plants
President Donald Trump threatened Wednesday to bomb bridges and power plants in Iran if Tehran targets ships in Hormuz.
"From this point forward, any time the Islamic Republic of Iran shoots at a ship in the Strait of Hormuz, whether it be by Missile, Rocket, Drone, or any other device or weapon, the United States will bomb and destroy ONE BRIDGE OR POWER PLANT, including those located next to, or in, the Capital City of Tehran," Trump said in a Truth Social post.
The U.S. military, meanwhile, carried out its 11th consecutive night of strikes against Iran. The attacks targeted Iranian military operations centers, maritime capabilities, aircraft hangars, drone storage facilities and military logistics infrastructure, U.S. Central Command said.
Oil prices in the $90 to $100 per barrel range are supported by tightening fundamentals as exports through Hormuz slow and are at risk in the Red Sea, said Ryan McKay with TD Securities in a note to clients.
"This latest escalation and throttling of flows by Iran has in turn sped up that repricing and has again opened the door to fatter right-tail scenarios the longer it goes on," McKay said.
https://www.cnbc.com/2026/07/22/oil-prices-iran-war-macro-rubio-brent-wti.html
By Irina Slav - Jul 23, 2026, 1:30 AM CDT

At least two tankers have turned away from the Bab el-Mandeb Strait after Yemen’s Houthis said they have struck two Saudi tankers in the chokepoint in the latest Middle East war escalation, saying they had violated the naval blockade that the Yemeni forces declared earlier this week.
According to reports, one of the tankers was loaded with Saudi crude for India and the other was carrying oil to China.
“While it’s only two vessels so far, it suggests owners and operators are taking the threat seriously,” Matthew Wright, principal freight analyst at Kpler, said, as quoted by India’s Telegraph. “If this becomes a broader trend, the implications extend well beyond a handful of diverted cargoes.”
“We targeted two Saudi oil tankers, named Encelia and Layla, for their violation of the blockade decision issued by the armed forces,” the Houthi forces spokesman, Yahya Saree, said, as quoted by Al Jazeera.
The Saudi Arabian state news agency SPA later confirmed a strike on one tanker that was on fire, Reuters said in a separate report about two Chinese tankers loaded with Saudi crude that were heading towards the Bab el-Mandeb Strait. The report said the vessels were indicating there were Chinese crews on board.
The publication said that a total of twenty-seven vessels had crossed the Red Sea chokepoint on Wednesday, including five crude oil tankers and one liquefied natural gas carrier. That was down from 38 tanker crossings on Tuesday. Meanwhile, Reuters also wrote that Strait of Hormuz traffic remained a fraction of pre-war levels, with 253 energy commodity carriers stuck in the Persian Gulf. Of these, 102 were crude oil tankers, 64 were LNG carriers, and 66 were loaded with liquefied petroleum gas.
Following the Houthi declaration of a naval blockade and the continued U.S. strikes on Iranian targets that have now extended into 12 consecutive days, oil prices have climbed substantially, with Brent crude topping $96 per barrel earlier today.
Gold and silver prices surged on July 22, 2026, as spot gold rose above $4,100 and silver reached $60 per ounce, signaling a strong market rally. The move boosted mining stocks, with Corta Gold, Eshan Gold, and New Pacific Metals rising over 5%. Harmony Gold, Kinross Gold, Eagle Minerals, Newman Minerals, Endeavour Silver, and First Majestic Silver all gained over 4%. The rally coincided with a shift in the Fear & Greed Index, indicating renewed investor confidence in physical assets.
On July 22, spot gold rose above $4,100, and spot silver broke through $60 per ounce, reaching its highest level since July 10. This drove a broad rally in gold and silver stocks, with Coldoron Mining, Ashanti Gold, and New Pacific Metals all rising over 5%. Harmony Gold, Kinross Gold, Eagle Minerals, Newman Mining, Endeavour Silver, and First Majestic Silver all gained over 4%. Gold Fields and American Gold Corporation rose nearly 4%, while Pan American Silver and Vista Gold advanced more than 3%. (Jin10)
https://www.kucoin.com/news/flash/gold-and-silver-prices-surge-mining-stocks-rally

(July 21): Chile is eyeing about US$100 billion (RM408.91 billion) in copper investments over the next decade as it seeks to tap demand from data centres and diversify its customer base beyond China, according to its top diplomat.
“It’s highly concentrated and we need to expand the number of places that are buying copper from us,” Chilean Foreign Affairs Minister Francisco Pérez Mackenna said at Bloomberg’s Sustainable Business Summit in Singapore on Wednesday.
To do that, Chile needs to invest heavily so it can move away from exporting concentrate and instead start shipping refined copper, he said.
“Probably China will continue to be a very significant client for our copper because of the industrial footprint they have,” Pérez Mackenna said but noted that demand for the metal should become even more widespread with the race to build data centres around the world.
The effort comes as countries rush to secure supplies of the metal which is a critical input in everything from power grids and electric vehicles to, recently, the data centres powering the global artificial intelligence boom.
Separately, Chile has begun negotiating a free trade agreement with India and will strengthen existing deals with its neighbours as part of a broader effort to reach more export markets, Pérez Mackenna said.
China has for years been the biggest buyer of Chilean copper, taking more than half of the country’s exports of the metal. But negotiations over annual supply contracts have become more difficult in recent years as mine disruptions constrained global supplies while a rapid expansion of China’s smelting industry heightened competition for copper concentrate.
The changing market has already prompted Chilean producer Antofagasta plc to propose linking annual copper concentrate contracts to spot-market indexes instead of fixed treatment and refining charges, challenging a pricing system that has underpinned the industry for decades.
The overall domestic molybdenum market maintained a high and firm operation, with the prices of molybdenum concentrate, ferromolybdenum, and molybdenum oxide at approximately RMB 5,320/ton-degree, RMB 339,000/ton, and RMB 5,420/ton-degree, respectively. Under this market condition, trading activity was generally moderate, and transactions were acceptable.
On the molybdenum concentrate market, the market condition was relatively good. Although the continuous rise of molybdenum prices to relatively high levels recently has reduced downstream users' enthusiasm for inquiries and purchases, due to strong production cost support and limited increases in spot supply, holders generally had low willingness to reduce prices for shipments. On the ferromolybdenum market, overall operations remained under pressure. Factors such as steel enterprises successively entering tenders for ferromolybdenum, tender prices being passively pushed higher, and low-priced feedstock being difficult to source jointly caused difficulties for intermediate smelting enterprises in quoting prices. On the molybdenum chemical and its products market, wait-and-see sentiment was strong. Against the background of relatively balanced supply and demand, product prices were mainly affected by upstream market conditions.
In terms of news, data from the China Iron and Steel Association shows that in early July 2026, key monitored steel enterprises produced a total of 18.65 million tons of pig iron, with an average daily output of 1.865 million tons, decreased by 1.8% month-on-month in daily output. By region, the daily output of pig iron in Northeast China decreased by 9,000 tons, in North China decreased by 42,000 tons, in Northwest China decreased by 1,000 tons, in East China increased by 1,000 tons, in Southwest China increased by 15,000 tons, and in Central South China increased by 2,000 tons.
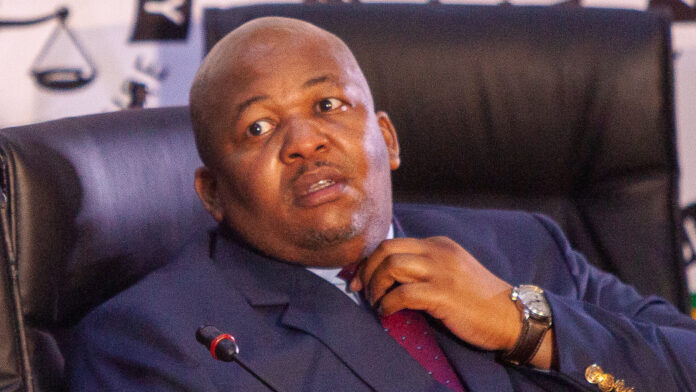
Dan Marokane, CEO, Eskom
The possible extension of electricity tariff discounts to sectors of the South African mining industry other than the ferrochrome producers will have to wait until after publication of a revised electricity pricing policy currently under preparation.
That’s according to Eskom CEO Dan Marokane answering questions after his presentation to the Coal and Energy Transition Day investment conference held in Johannesburg today.
Marokane said he was “encouraged” that the ministry which decides electricity pricing policy had decided there was a need to revise that policy.
“There will be published in a very short period of time – I think less than a month away – a revised energy policy that seeks to protect the poor; that seeks to support the strategic sectors of the economy, and also seeks to ensure that generators are sustainable,” he said.
Eskom has so far granted tariff relief to the ferrochrome smelters owned by the Merafe Glencore Venture and Samancor so saving several thousand jobs and is considering cutting its tariffs to manganese smelter Transalloys which is also threatened with closure.
Marokane commented: “We had to start somewhere and, of course, we started off in the ferrochrome industry because of the crisis they were facing. Those conversations were not easy.
“We understood what price they wanted to make them competitive and save a number of jobs in that sector and also to protect the country’s competitiveness when it comes to the chrome industry as a whole. We extended that to other sectors that are energy intensive but, unfortunately, we will not be able to do a ‘big bang’ approach.”
Marokane said that could not happen until the new energy policy was known and Eskom also had to make sure that it would survive the changes.
“We have to create rules that are common to everyone. We cannot have rules for one party and rules for others,” he said.
Among the other energy-intensive mining sector users are the country’s platinum producers which use large volumes of power to refine their ore concentrates into the various platinum group metals and base metals output.
Valterra Platinum CEO Craig Miller told Miningmx on July 6 that: “I recognise what needed to be done in the ferroalloy industry but two years ago I needed to reduce my headcount by 3,500 jobs because costs had increased so significantly.
“Prices were incredibly low and we needed to take costs out of the business in order to sustain the long- term. Where was our special tariff?”
Valterra chairman Norman Mbazima commented in the company’s 2025 annual report that “the absence of meaningful structural reform continues to weigh on the local mining industry with persistent cost pressures eroding South Africa’s competitive edge.
“Mining input costs such as labour compensation and administrative prices (particularly electricity) have consistently outpaced consumer inflation undermining the sector’s competitiveness.”
https://www.miningmx.com/top-story/65962-mining-tariff-relief-awaits-new-eskom-pricing-policy/

At the same time, ore imports rose by 6.3% y/y over the same period
Iron ore production in China for the first six months of 2026 fell by 7% compared with the same period in 2025, totalling 466.9 million tonnes. The decline accelerated significantly in June, when output fell by 19.8% year-on-year – to 70.4 million tonnes, marking the lowest monthly level on record. This was reported by MySteel, citing data from the National Bureau of Statistics of China.
Amid declining domestic production and the need to replenish stocks, Chinese steelmakers have significantly increased their purchases of raw materials from abroad. China, which accounts for around 75% of global seaborne iron ore imports, increased its imports by 6.3% year-on-year in the first half of the year to 628.9 million tonnes. In particular, June imports rose by 6.4% year-on-year, reaching a six-month high of 112.7 million tonnes, according to Reuters.
The rise in imports is taking place against a backdrop of a gradual decline in stock levels at ports. According to SteelHome analysts, port ore stocks have fallen to 156.6 million tonnes compared with March’s record high of 166.9 million tonnes. However, this level is still 19.6% higher than last July’s figures.
An additional incentive for overseas purchases has been the softening of prices caused by high supply from leading exporters — Australia, Brazil and new players, notably Guinea. On the Singapore Exchange, iron ore futures are trading at around $99 per tonne, which is significantly lower than May’s peak of $111.9 per tonne.
Experts note that, given the high levels of port stocks and the expected growth in global supply (notably due to the expansion of capacity at Guinea’s Simandou project), there are currently no grounds for sustained growth in imports or prices.
At the same time, the possible introduction of additional economic stimulus measures by the Chinese government, against the backdrop of moderate GDP growth in the second quarter (4.3% year-on-year), could prove to be a positive factor for the country’s steel sector.
As reported by GMK Center, China reduced its iron ore production by 2.8% year-on-year in 2025, to 983.71 million tonnes. Also, last year, China increased its iron ore imports by 1.8% year-on-year – to 1.26 billion tonnes; these volumes have been rising for the third consecutive year.
https://gmk.center/en/news/china-s-iron-ore-production-fell-by-7-y-y-in-1h2026/

