By Anushree Mukherjee and Kavya Balaraman
(Reuters) -Platinum and palladium prices have both rallied this month, notching a more than four-year and seven-month high respectively, but analysts say they remain more cautious about the outlook for palladium due to its narrower demand base.
Spot platinum was trading at $1,272.45 per ounce as of 1545 GMT on Wednesday, its highest level since February 2021, and has risen 41% this year on supply concerns, renewed investor interest following London Platinum Week in May, and increased jewellery demand as high gold prices drive consumers to cheaper alternatives, analysts say.
Spot palladium, meanwhile, was trading at $1,078.62/oz, its highest level since November 2024, and has gained 18% this year, but has struggled to reach the high of $1,244.75 hit in October 2024.
"The biggest factor is likely the wider appeal which platinum enjoys. Platinum’s uses are more diverse, spanning industrial applications, jewelry, and investor demand," said Zain Vawda, market analyst at MarketPulse by OANDA.
"This diversification shields platinum from the headwinds palladium faces, such as declining long-term demand from the traditional automotive market due to the EV transition."
Palladium is mainly used in catalytic converters for gasoline vehicles, while platinum has broader uses in diesel catalytic converters, jewellery, industrial applications, and emerging hydrogen technologies.
PALLADIUM PRICES LAGGING
Palladium could be considered a "one trick pony", with 90% of its demand coming from car manufacturers, Bank of America said in a note last week.
"China's rising EV penetration rates are particularly damaging because it means that palladium-intensive cars with a gasoline engine are now being quickly displaced," the note added.
The transition to EVs will also affect platinum in the medium term, but to a lesser extent, analysts told Reuters.
"Large commercial vehicles will likely use larger amounts of platinum (relative to palladium) and these vehicles will be slower to electrify. Over time, the hydrogen economy will also absorb some platinum, limiting the downside risk on platinum versus palladium," said Nitesh Shah, commodities strategist at WisdomTree.
Global sales of battery-electric vehicles and plug-in hybrids rose to 1.5 million in April. Sales in China were up 32% from the same month of 2024 to 0.9 million vehicles.
PLATINUM RALLIES
Platinum, meanwhile, is expected to be moderately supported over the next six to 12 months, although the upside may be capped without a clear rebound in auto demand or meaningful acceleration in hydrogen-related applications, said Alexander Zumpfe, a precious metals trader at Heraeus Metals Germany.
https://finance.yahoo.com/news/platinum-surges-palladium-lags-narrow-163815752.html
New Delhi: A disruption in rare earth magnet supplies lasting beyond a month can impact production of passenger vehicles, including electric models, weighing on the domestic automobile industry’s growth momentum, a report on Tuesday said.
Rare earth magnets, low in cost but critical in function, could emerge as a key supply-side risk for India’s automotive sector if China’s export restrictions and delays in shipment clearances persist, Crisil Ratings said in a statement. “The supply squeeze comes just as the auto sector is preparing for aggressive EV rollouts. Over a dozen new electric models are planned for launch, most built on PMSM platforms,” Crisil Ratings Senior Director Anuj Sethi said.
While most automakers currently have 4-6 weeks of inventory, prolonged delays could start affecting vehicle production, with EV models facing deferrals or rescheduling from July 2025, he added. A broader impact on two-wheelers and ICE PVs may follow if the supply bottlenecks persist for an extended period, Sethi said. “The shortage of rare earth magnets is forcing automakers to reassess supply-chain strategies. Despite contributing less than 5 per cent of a vehicle’s cost, these magnets are indispensable for EV motors and electric steering systems,” said Crisil Ratings Director Poonam Upadhyay. Automakers are actively engaging with alternative suppliers in countries such as Vietnam, Indonesia, Japan, Australia, and the US, while also optimising existing inventories, she noted.
Rare earth magnets are integral to Permanent Magnet Synchronous Motors (PMSMs) used in EVs for their high torque, energy efficiency and compact size. Hybrids also depend on them for efficient propulsion. In internal combustion engine (ICE) vehicles, the use of rare earth magnets is largely limited to electric power steering and other motorised systems. In April this year, China, the world’s dominant exporter of rare earth magnets, imposed export restrictions on seven rare earth elements and finished magnets, mandating export licences.
The revised framework demands detailed end-use disclosures and client declarations, including confirmation that the products will not be used in defence or re-exported to the US. With the clearance process taking at least 45 days, this added scrutiny has significantly delayed approvals.
https://www.thehansindia.com/business/rare-earth-magnets-supply-risk-to-india-978830

Low water levels at the Haweswater reservoir in the valley of Mardale, Cumbria. The north west of England is now in drought following one of the driest springs on record.
It has been an exceptionally dry spring in north-western Europe and the second warmest May ever globally, according to the Copernicus Climate Change Service (C3S).
Countries across Europehave been hit by drought conditions in recent months, with water shortages feared unless significant rain comes this summer, and crop failures beginning to be reported by farmers.
The new Copernicus data shows that May 2025 was the second-warmest May globally, with an average surface air temperature of 15.79 degrees, 0.53 degrees above the 1991-2020 average for May. The month was 1.4 degrees above the estimated 1850-1900 average used to define the pre-industrial level. This interrupts a period of 21 months out of 22 where the global average temperature was more than 1.5C above the pre-industrial level.
Carlo Buontempo, director of C3S at the European Centre for Medium-Range Weather Forecasts (ECMWF), said: “May 2025 breaks an unprecedentedly long sequence of months over 1.5 degrees above pre-industrial. Whilst this may offer a brief respite for the planet, we do expect the 1.5 degrees threshold to be exceeded again in the near future due to the continued warming of the climate system.”
The 1.5 degrees is the climate target agreed by the 2015 Paris agreement. The target of 1.5 degrees is measured over a decade or two, so a single year above that level does not mean the target has been missed, but does show the climate emergency continues to intensify.
Every year in the past decade has been one of the 10 hottest, in records that go back to 1850.
Dry weather has persisted in many parts of the world.
In May 2025, much of northern and central Europe as well as southern regions of Russia, Ukraine, and Turkey were drier than average.
Parts of north-western Europe experienced the lowest precipitation and soil moisture levels since at least 1979.
In May 2025, it was drier than average in much of north America, in the Horn of Africa and across central Asia, as well as in southern Australia, and much of both southern Africa and South America.
May also saw abnormally high sea surface temperatures in the north-eastern Atlantic, reaching the highest ever recorded, according to Copernicus. - Guardian
Beijing has a virtual monopoly on supply of the critical minerals used to make everything from cars to wind turbines.
China’s export of rare earth elements is central to the trade deal struck this week with the United States.
Beijing has a virtual monopoly on the supply of the critical minerals, which are used to make everything from cars to drones and wind turbines.
Earlier this year, Beijing leveraged its dominance of the sector to hit back at US President Donald Trump’s sweeping tariffs, placing export controls on seven rare earths and related products.
The restrictions created a headache for global manufacturers, particularly automakers, who rely on the materials.
After talks in Geneva in May, the US and China announced a 90-day pause on their escalating tit-for-tat tariffs, during which time US levies would be reduced from 145 percent to 30 percent and Chinese duties from 125 percent to 10 percent.
The truce had appeared to be in jeopardy in recent weeks after Washington accused Beijing of not moving fast enough to ease its restrictions on rare earths exports.
After two days of marathon talks in London, the two sides on Wednesday announced a “framework” to get trade back on track.
Trump said the deal would see rare earth minerals “supplied, up front,” though many details of the agreement are still unclear.
What are rare earths, and why are they important?
Rare earths are a group of 17 elements that are essential to numerous manufacturing industries.
The auto industry has become particularly reliant on rare-earth magnets for steering systems, engines, brakes and many other parts.
China has long dominated the mining and processing of rare earth minerals, as well as the production of related components like rare earth magnets.
It mines about 70 percent of the world’s rare earths and processes approximately 90 percent of the supply. China also maintains near-total control over the supply of heavy rare earths, including dysprosium and terbium.

China’s hold over the industry had been a concern for the US and other countries for some time, but their alarm grew after Beijing imposed export controls in April.
The restrictions affected supplies of samarium, gadolinium, terbium, dysprosium, lutetium, scandium, and yttrium, and required companies shipping materials and finished products overseas to obtain export licences.
The restrictions followed a similar move by China in February, when it placed export controls on tungsten, bismuth and three other “niche metals”.
While news of a deal on rare earths signals a potential reprieve for manufacturers, the details of its implementation remain largely unclear.
What has been the impact of the export restrictions?
Chinese customs data shows the sale of rare earths to the US dropped 37 percent in April, while the sale of rare earth magnets fell 58 percent for the US and 51 percent worldwide, according to Bloomberg.
Global rare earth exports recovered 23 percent in May, following talks between US and Chinese officials in Geneva, but they are still down overall from a year earlier.
The greatest alarm has been felt by carmakers and auto parts manufacturers in the US and Europe, who reported bottlenecks after working their way through inventories of rare earth magnets.
“The automobile industry is now using words like panic. This isn’t something that the auto industry is just talking about and trying to make a big stir. This is serious right now, and they’re talking about shutting down production lines,” Mark Smith, a mining and mineral processing expert and the CEO of the US-based NioCorp Developments, told Al Jazeera.
Even with news of a breakthrough, Western companies are still worried about their future access to rare earths and magnets and how their dependence on China’s supply chain could be leveraged against them.
The Financial Times reported on Thursday that China’s Ministry of Commerce has been demanding “sensitive business information to secure rare earths and magnets” from Western companies in China, including production details and customer lists.
What have the US and China said about rare earth exports?
Trump shared some details of the agreement on his social media platform, Truth Social, where he also addressed concerns about rare earths and rare earth magnets.
“We are getting a total of 55% tariffs, China is getting 10%. The relationship is excellent,” Trump said, using a figure for US duties that includes levies introduced during his first term.
“Full magnets, and any necessary rare earths, will be supplied, up front, by China. Likewise, we will provide to China what was agreed to, including Chinese students using our colleges and universities (which has always been good with me),” Trump said.
Ahead of the negotiations in London, China’s Ministry of Commerce had said it approved an unspecified number of export licences for rare earths, and it was willing to “further strengthen communication and dialogue on export controls with relevant countries”.
However, an op-ed published by state news outlet Xinhua this week said rare earth export controls were not “short-term bargaining tools” or “tactical countermeasures” but a necessary measure because rare earths can be used for both civilian and military purposes.
NioCorp Developments’ Smith said Beijing is unlikely to quickly give up such powerful leverage over the US entirely.
“There’s going to be a whole bunch of words, but I really think China is going to hold the US hostage on this issue, because why not?” he said.
“They’ve worked really hard to get into the position that they’re in. They have 100 percent control over the heavy rare earth production in the world. Why not use that?”
Deborah Elms, the head of trade policy at the Hinrich Foundation in Singapore, said it was hard to predict how rare earths would be treated in negotiations, which would need to balance other US concerns like China’s role in exporting the deadly opioid fentanyl to the US.
Beijing, for its part, will want guarantees that it can access advanced critical US technology to make advanced semiconductors, she said.
Abu Dhabi’s main oil company is evaluating whether it can acquire some of BP Plc’s key assets, should the embattled British firm decide to break itself up or come under pressure to divest more units, according to people familiar with the matter.
Abu Dhabi National Oil Co. (Adnoc) has been internally studying prospects for acquiring certain BP assets and has held initial consultations with bankers, the people said, requesting anonymity as the discussions are private. It is also considering partnering with another bidder to split the assets, they added.
Adnoc is most interested in BP’s liquefied natural gas (LNG) and gas fields, rather than acquiring the entire company, though it has considered that option, the people said. Adnoc recently launched an international unit called XRG PJSC, tasked with pursuing gas and chemicals deals, with a target enterprise value of $80 billion.
Any deal would likely be pursued through XRG, some sources noted. Adnoc or XRG may also consider BP’s fuel retailing business. Adnoc referred questions to XRG, which declined to comment. BP also declined to comment. The plans remain under consideration and Adnoc could ultimately choose not to bid, the people said.
BP has faced prolonged underperformance, driven largely by its earlier focus on a net-zero strategy. CEO Murray Auchincloss is attempting a reset by shifting back to oil and gas and has promised asset sales. Several oil majors have examined BP’s assets amid a drop in its market value—down a third in just over a year to below $80 billion.
Adnoc is not interested in BP’s oil production assets or refineries, making a full takeover unlikely. Political sensitivities are also a deterrent. A UAE-linked firm recently faced backlash in the UK over its proposed acquisition of the Telegraph, after British authorities moved to block foreign state ownership of newspapers. Nonetheless, Abu Dhabi-based firms have begun investing in UK assets again, suggesting a thaw in relations.
Also Read: Lower oil prices will not impact flow of orders from Middle East: L&T
Funding is another potential hurdle. Despite being cash-rich and able to tap the debt market, Adnoc lacks a publicly traded stock and would have to pay entirely in cash for any full acquisition.
Adnoc and BP share a long-standing relationship. BP played a key role in discovering oil in Abu Dhabi over 50 years ago and holds a minority stake in Adnoc’s largest onshore field, which produces the Murban crude benchmark. BP also holds a 10% stake in an LNG facility under construction in the UAE and has joint ventures with Adnoc for gas development in Egypt and the eastern Mediterranean.
In May, XRG stated its ambition to become one of the world’s leading integrated gas companies within a decade, targeting LNG capacity of 25 million tonnes per year.
(-By Anthony Di Paola and Dinesh Nair; With assistance from Mitchell Ferman)
By Irina Slav - Jun 12, 2025, 3:19 AM CDT
Energy Secretary Chris Wright does not expect U.S. crude oil production to decline in 2026, although the Energy Information Administration forecast such a development.
“That is a projection — we don’t know what’s going to happen next year,” Wright told Bloomberg in an interview. “We have seen weak prices for a few months, and if prices are too low for an economic incentive, you’ll see some drilling reduce on the margin. I think it’s unlikely you’ll see enough reduction to actually see a decline in production next year.”
The Energy Information Administration said earlier this week it expected oil production in the U.S. to decline from 13.5 million barrels daily in the second quarter of this year to 13.3 million barrels daily in 2026 as shale oil peaks. The authority cited weak oil prices as one reason for the expected decline, while some industry executives have pointed to the exhaustion of low-cost shale deposits as a driver of the potential future decline.
Bloomberg noted in its report that shale drillers have been laying off workers and cutting the number of drilling rigs in the patch but Wright said that “This administration is making it lower cost for them to drill wells and therefore a lower threshold at which they would start to pull back activity.”
The most vulnerable players in the shale patch are smaller independents. Supermajors such as Exxon, Chevron, and ConocoPhillips are in a business-as-usual mode, yet some of them have already said that the peak in U.S. oil production is being accelerated and could come sooner than previously expected.
“As you know that most of the shale basins now have either plateaued or are starting to decline, except for the Permian,” Occidental’s Vicki Hollub said on the company’s Q1 call.
Conoco’s Ryan Lance, for his part, said that at $60 per barrel, “the folks that don't have the kind of cost of supply sitting in their portfolio are going to find themselves cash-strapped and returns-strapped.”
Gold mine output in Australia fell 7% quarter-over-quarter as more miners used lower-grade stockpiled material to blend into their mill feed, a new report says.
Australia, the world’s largest gold producer after China, produced 73 tonnes of the yellow metal in the first three months of 2025 compared with 79 in the previous quarter, Melbourne-based mining consultants Surbiton Associates said in a statement dated Sunday. Production in the first quarter of 2024 was 70 tonnes.
The rising price of gold, which hit a historic high of $3,500 per oz. in April, is making previously unprofitable lower-grade ore economic, pushing miners to use more lower-quality material into their feed. Reclaimed stockpiled material now represents about 15% of the total ore being treated in Australia, up from about 1% a year ago, Surbiton says.
“Effectively the recent decline in Australian gold production was largely the result of higher gold prices,” Sandra Close, a director of Surbiton Associates, said in the statement.
Higher gold prices “mean that it is economic to reclaim more low-grade material from stockpiles to feed into the treatment plants, so the weighted average head grade of ore being treated declines,” Close added. “Although lower head grades result in less gold being produced and means cash costs and all-in sustaining costs per ounce increase, the value of each ounce of gold is higher.”
38% price rise
London Bullion Market Association gold prices averaged $2,859.60 an oz. in the first quarter of 2025, a 7.4% rise over 2024’s final quarter, World Gold Council data show. Compared with a year ago, first-quarter prices jumped 38%.
While higher gold prices could be expected to boost output by encouraging the startup of new projects and the re-commissioning of past-producing mines, many existing treatment plants are running close to their limit, Close said. This has caused a shortage of immediate treatment capacity for emerging small miners that want to sell parcels of ore or to have their ore toll-treated.
Mixed bag for output
Even so, “many gold producers are experiencing high margins and are doing very well,” Close said.
AngloGold Ashanti’s (NYSE: AU) and Regis Resources’ (ASX: RRL) Tropicana mine, Gold Fields’ (NYSE, JSE: GFI) St Ives and Newmont’s (TSX: NGT; NYSE: NEM) Tanami were among the Australian operations that saw production drop during the first quarter. Tropicana produced 57,000 fewer ounces, while output at Tanami fell by 46,000 oz. and that of St Ives fell by 40,500 ounces.
Among the operations that produced more gold were Newmont’s Cadia mine, up 25,000 oz.; Bellevue Gold Mines’ (ASX: BGL) Bellevue, up 22,000 oz.; and Agnico Eagle Mines’ (TSX: AEM; NYSE: AEM) Fosterville property, up 7,000 ounces.
https://www.mining.com/australia-gold-output-falls-as-miners-tap-stockpiles/
Seabridge Gold Inc. (TSE:SEA - Get Free Report) NYSE: SA's share price crossed above its 200-day moving average during trading on Tuesday . The stock has a 200-day moving average of C$17.24 and traded as high as C$20.17. Seabridge Gold shares last traded at C$19.65, with a volume of 105,436 shares.
Get Seabridge Gold alerts: Sign Up
Seabridge Gold Trading Down 1.9%
The business has a 50 day moving average price of C$16.93 and a 200-day moving average price of C$17.24. The company has a current ratio of 2.28, a quick ratio of 3.34 and a debt-to-equity ratio of 58.83. The company has a market cap of C$1.81 billion, a P/E ratio of -139.15 and a beta of 1.09.
About Seabridge Gold
Seabridge Gold Inc is a development stage company involved in the evaluation, acquisition, exploration, and development of gold properties sited in North America. The company's principal projects include the Kerr-Sulphurets-Mitchell property located in British Columbia, the Courageous Lake property located in the Northwest Territories and its newly acquired Iksut Property located in northwestern British Columbia.
Read More
This instant news alert was generated by narrative science technology and financial data from MarketBeat in order to provide readers with the fastest and most accurate reporting. This story was reviewed by MarketBeat's editorial team prior to publication. Please send any questions or comments about this story to contact@marketbeat.com.
Before you consider Seabridge Gold, you'll want to hear this.
MarketBeat keeps track of Wall Street's top-rated and best performing research analysts and the stocks they recommend to their clients on a daily basis. MarketBeat has identified the five stocks that top analysts are quietly whispering to their clients to buy now before the broader market catches on... and Seabridge Gold wasn't on the list.
While Seabridge Gold currently has a Hold rating among analysts, top-rated analysts believe these five stocks are better buys.
View The Five Stocks Here
US copper tariff threats have created a lucrative windfall for Freeport-McMoRan Inc., America’s largest copper producer, though the company’s CEO warns that comprehensive trade barriers could ultimately damage the very industry President Donald Trump seeks to strengthen.
“If global growth is disrupted, that could lead to an impact on copper prices,” CEO Kathleen Quirk told Bloomberg News during an interview at the company’s Phoenix headquarters. “Ironically, if we’re trying to build up the US copper industry, slowing GDP growth and inflation could put a lot of pressure on mines here.”
The tariff speculation has created a substantial price differential, with US copper trading approximately 9.3% above London Metal Exchange rates. This premium previously reached 13% in April, translating to roughly $800m in annual financial benefits for Freeport’s copper sales, according to Bloomberg News.
Trump directed the Commerce Secretary in late February to investigate foreign copper imports under Section 232 of the Trade Expansion Act, with a 270-day deadline for recommendations. This provision grants presidential authority to impose restrictions citing national security concerns.
Freeport controls about 70% of America’s processed copper through seven open-pit facilities and one smelter. The pricing advantage encourages traders to direct supplies toward US markets ahead of potential duties.
However, Quirk acknowledges the double-edged nature of protection measures. “We do benefit from having a copper tariff because it prices our copper higher domestically,” the 62-year-old CEO told Bloomberg News. “If we have these big tariffs and trade wars, that makes us concerned for global demand for copper.”
The company operates internationally across Indonesia, Spain, Peru and Chile, making it vulnerable to retaliatory measures or reduced global consumption.
Quirk, who became CEO last year after joining Freeport in 1989, advocates for alternative support mechanisms including tax credits similar to those available for lithium and nickel producers under the Inflation Reduction Act.
https://www.miningmx.com/trending/61451-copper-tariffs-offer-mixed-blessing-for-industry/
Uncertainty Dominates Copper Market Outlook
By Metal Miner - Jun 11, 2025, 2:00 PM CDT
Copper Prices Open June With Uncertainty
Comex copper prices appeared surprisingly stable in the first weeks of June as they took a pause from the heightened volatility that had plagued the market since the start of the year. While it remained sideways, the trend showed modest optimism. As of June 9, prices sat roughly 10 cents higher than where they started the month.
U.S. trade policy largely ruled copper market sentiment during the first half of 2025. For instance, the possibility of U.S. copper tariffs fueled a strong rally during Q1. However, this had at least partially collapsed by April. That drop followed the announcement of reciprocal tariffs that risked a much gloomier demand outlook for the industrial metals sector.
Even if the pause in reciprocal tariffs proves only temporary, it still allowed copper prices to claw back some of their gains before stabilizing in May. Copper prices today, like other indices, seem to be awaiting more clarity.
U.S. Trade Policy to Decide Copper Price Trend
While there are plenty of other factors that shape the global copper market, few seem to be getting much attention since the start of the year. All eyes remain fixed on the U.S. trade negotiations currently underway, all of which could have big implications for U.S. demand depending on how they shake out.
Discussions with China resumed on June 10, offering some optimism to markets. China faces the most significant tariff rates, even though most remain on pause for now. This makes the ongoing negotiations among the most consequential to the fate of the global economy in the coming year. Beyond China, there is a long list of other countries in talks with the U.S. as well.
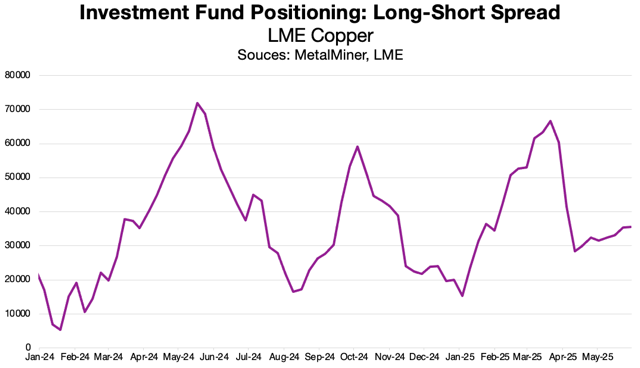
Investment fund positioning has largely echoed cautious optimism. According to data from the LME, funds remain net long, suggesting the overall expectation that copper prices will appreciate in the months ahead. However, the bias sits at a noticeably lower level than where it stood at its peak earlier this year or in the year past.
As large position holders, these funds hold significant sway over market direction. This makes their overall sentiment critical to determining copper prices today, tomorrow, and in the future.
U.S. Copper Tariffs Remain in Limbo
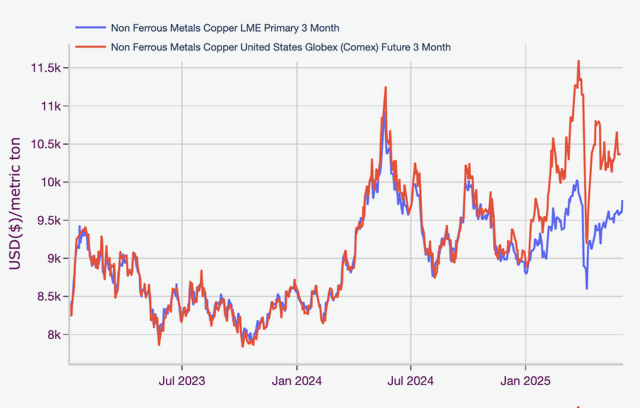
As markets follow trade negotiations, potential U.S. copper tariffs still loom on the horizon. The White House has offered little clarity as to where it stands with the possible duties since announcing an investigation into copper imports in February. The impact of the announcement has been playing out across global exchanges, with Comex copper prices today securing and maintaining a historically wide premium over their LME counterparts.
Source: MetalMiner Insights, Chart & Correlation Analysis Tool
After years of parity, Comex prices have averaged nearly 9% higher since the start of 2025. At its highest in early April, Comex prices held a more than 20% premium over LME prices. As Comex prices trended sideways over the last months, the recent gains in LME prices helped narrow that spread to an extent. However, as of early June, it appears that investors are still pricing in a roughly 7% likelihood that copper tariffs will hit the U.S.
Shifting Trade Flows and U.S. Demand
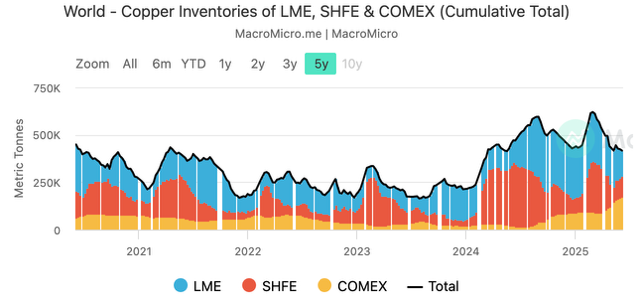
Beyond pricing dynamics, possible copper tariffs have had a notable influence over exchange inventories, helping shift trade flows to the United States. Comex copper inventories now tower over both SHFE and LME inventories, which is historically atypical considering the relative immaturity of the Comex copper contract.
Source: MacroMicro
U.S. demand remains strong amid the proliferation of data centers and the growing need for electrification. That said, the sharp uptick in Comex stocks also poses a threat to Comex copper prices should the U.S. decide not to impose copper tariffs. Elevated stocks will offer no support to prices, especially if ongoing trade negotiations sour demand expectations over the coming months in addition to forgoing copper tariffs.
However, much like the currently sideways copper price trend, much remains undecided. This means volatility likely awaits the copper market in the second half of the year, a perhaps unwelcome disruption to the brief moment of calm markets have enjoyed over the last month.
https://oilprice.com/Metals/Commodities/Uncertainty-Dominates-Copper-Market-Outlook.html
As of the week ending June 6, the global cold rolled sheet market is displaying clear regional divergence. Germany maintains a steady and self-reliant supply chain, while the U.S. and China face heightened volatility driven by trade restrictions, economic uncertainties, and cautious demand across key sectors.
The U.S. Cold Rolled Sheet industry has witnessed a price drop of late, led by changing patterns of demand and lowering domestic import volumes. Total supply continues to remain tight as the restricted steel imports along with the effects of heavy import tariffs on the back of tepid demand continue to put pressure on the local market. The changing import scene brought in uncertainty of whether supplies would be available or not, leading to domestic producers having to rethink their near-term production and distribution plans. In turn, demand for cold rolled sheet products is also weak, as influenced by a conservative economic climate. Although segments such as construction and auto are providing some degree of support, overall market demand is slowing down as purchasers are becoming increasingly tight-fisted with buying decisions and alter inventories as well. Market volatility, fueled by trade tariffs and persistent geopolitical tensions, remains a drag on buyer sentiment.
German cold rolled sheet prices remain stable. The stability is attributed to level production and consistent demand, which are characteristic of a good market equilibrium. German steelmakers have maintained a consistent output, which guarantees production matches domestic consumption. Moreover, import and export pressures have not been significant concerns, as local producers are sufficiently meeting most of the demand without depending on foreign products.
Cold rolled sheet prices in China experienced decline due to fluctuation in supply and demand. Additionally, demand for Cold Rolled Sheet in China remains weak, hard hit by unfavourable terminal sector procurement and harsh weather conditions, which reduced building and manufacturing activity. Even the issuance of new national standards created uncertainty on the market as buyers were reluctant to purchase. Also, social inventory changes are a slowdown in demand as buyers postpone fresh purchases. Additionally, speculations of an impending global recession have sapped market sentiment, prompting downstream industries to exercise restraint in restocking Cold Rolled Sheet at previous levels.
According to ChemAnalyst, cold rolled sheet prices in the U.S. and China may face downward pressure as inventory levels rise. In contrast, prices in Germany are expected to remain stable, supported by steady market conditions with no significant fluctuations observed.
With a market cap of $28.8 billion , Nucor Corporation ( NUE ) is a leading North American manufacturer of steel and steel products. Operating through its Steel Mills, Steel Products, and Raw Materials segments, Nucor produces a wide range of materials, including sheet steel, structural beams, steel joists, and direct reduced iron (DRI).
Companies worth more than $10 billion are generally described as “large-cap” stocks, and Nucor fits this criterion perfectly. With a strong presence across the United States and Canada, the company has expanded through acquisitions and a strategic network of mini-mills to serve diverse industrial markets.
Shares of the Charlotte, North Carolina-based company have decreased 26.9% from its 52-week high of $170.52 . NUE’s shares have fallen 1.6% over the past three months, underperforming the VanEck Steel ETF’s ( SLX ) 9.1% gain over the same time frame.
In the longer term, NUE stock is up 6.8% on a YTD basis, lagging behind SLX’s 12.8% increase . In addition, shares of the steelmaker have declined 20.7% over the past 52 weeks, compared to SLX’s 2.4% dip over the same time frame.
Despite a few fluctuations, the stock has been trading mostly below its 50-day and 200-day moving averages since last year.
Shares of Nucor rose 1.9% following its Q1 2025 results on Apr. 28 due to stronger-than-expected financial performance , including an adjusted profit of $0.77 per share and revenue of $7.8 billion. The 10% increase in shipments from its steel mills segment to 6.4 million tonnes, driven by higher domestic demand and rising spot prices of hot-rolled coil (HRC), also boosted investor confidence.
However, NUE stock has performed weaker than its rival, Steel Dynamics, Inc. ( STLD ). STLD stock soared 17.3% on a YTD basis and 8.2% over the past 52 weeks.
https://www.inkl.com/news/how-is-nucor-s-stock-performance-compared-to-other-steel-stocks
Stainless steel mill resumes price limits, low-priced supply decreases, and quotations become more concentrated [SMM Stainless Steel Daily Review]
[SMM Daily Review of Stainless Steel: Stainless Steel Mills Resume Price Limits, Low-Priced Supplies Decrease, Quotations Become More Concentrated] SMM reported on June 11 that today, the SS futures market showed a trend of stopping falling and rebounding, once again testing and returning to 12,600 yuan/mt. Yesterday, some agents and traders took advantage of the low prices to build positions and purchase goods, which, to a certain extent, alleviated the shipping pressure on stainless steel mills. This morning, stainless steel mills resumed their price limit operations. Despite the significant downward shift in the market's price center and the lack of obvious positive support, making it difficult for prices to rebound sharply, the resumption of price limits by steel mills, combined with the current low prices in recent years, has also faced resistance to further price declines.
Some low-priced supplies have disappeared, and quotations have become more concentrated. In the futures market, the most-traded 2508 contract stopped falling and rebounded. At 10:30 a.m., SS2508 was quoted at 12,505 yuan/mt, down 40 yuan/mt from the previous trading day. In the Wuxi region, the spot premiums/discounts for 304/2B stainless steel ranged from 465-665 yuan/mt.
In the spot market, the cold-rolled 201/2B coils in Wuxi and Foshan were both quoted at 7,800 yuan/mt; the cold-rolled trimmed 304/2B coils had an average price of 12,925 yuan/mt in Wuxi and 12,925 yuan/mt in Foshan; the cold-rolled 316L/2B coils were priced at 24,000 yuan/mt in Wuxi and 24,000 yuan/mt in Foshan; the hot-rolled 316L/NO.1 coils were quoted at 23,350 yuan/mt in both regions; the cold-rolled 430/2B coils were both priced at 7,500 yuan/mt in Wuxi and Foshan. Currently, the stainless steel market is mired in the traditional consumption off-season, with downstream demand remaining sluggish.