2019-05-13 13:43 First FinanceI want to comment 0
Font size:
From January to March this year, among the 20 cities with the national air quality status notified by the Ministry of Ecology and Environment, Xianyang, Weinan and Xi'an were among them. In the 20 cities ranked after the relatively poor air quality in 2018, Xianyang and Weinan are also on the list.
The Central Second Ecological Environmental Protection Inspector Group today (13th) pointed out to Shaanxi Province's “review” and special inspections that the special inspectors found that Shaanxi Province has done a lot of work in the field of air pollution prevention and control, and the quality of the atmospheric environment has been improved. Improvement, but the problem of structural pollution is still outstanding, and the situation is still grim.
In the new round of national air pollution prevention and control action plan, the Yan Plain was identified as a key area alongside the Beijing-Tianjin-Hebei region and the surrounding areas and the Yangtze River Delta region, involving Luliang, Jinzhong, Linyi and Yuncheng in Shanxi Province and Luoyang in Henan Province. There are 11 cities including Sanmenxia City, Xi'an, Xianyang, Baoji, Tongchuan, Weinan and Yangling Demonstration Zones in Shaanxi Province.
The Shaanxi Provincial Government issued the "Three-Year Action Plan for the Battle of the Iron and Steel in Shaanxi Province to Win the Blue Sky Defence War (2018-2020)", saying that the proportion of Shaanxi's secondary industry in the total economic output is 49.8%, which is higher than the national average of 9.3. percentage point. Coal accounts for 8.2 percentage points of primary energy. The emission intensity of sulfur dioxide and nitrogen oxides in Guanzhong area is 3.9 times and 3.6 times of the national average.
The overall industrial structure and energy structure are not good, resulting in obvious characteristics of composite air pollution. PM10, PM2.5 and ozone have become the main factors affecting the air quality in Shaanxi Province. In 2017, Shaanxi's coal accounted for about 75% of the primary energy consumption structure, and did not meet the target of reducing to below 67%.
In addition, is Shaanxi Province really active and effective in the prevention and control of air pollution? At the feedback meeting held today, Zhu Zhixin, the head of the inspection team, said that Shaanxi Province’s “reduction of coal is not strict, clean coal is not well protected, and some industries are seriously polluted.” “Don’t dare to touch hard in rectification” Rectification and surface rectification are more common."
The inspector group pointed out these problems in Shaanxi Province:
In the rectification, I dare not touch the hard, and I dare not manage and do not want to control large enterprises. The first round of inspectors transferred the pollution problem of Shaanxi Huangling Coal Chemical Company five times, but it was not rectified. In the law enforcement inspection of the National People's Congress in 2018, it was discovered that Yanchang Xinghua Chemical Company sneaked exhaust gas and Jinduicheng Molybdenum Co., Ltd. had long-term excessive discharge of sulfur dioxide. The “Looking Back” also found that Hancheng Longmen Coal Chemical Company and other four companies Similar to corporate environmental violations.
The problem of coal reduction in Shaanxi Province has not been effectively rectified. The coal reduction work of the Provincial Development and Reform Commission mainly relies on aggregated data. In particular, the requirements for coal reduction by power companies are soft and soft, and the work of “fixing electricity by heat” and optimizing power dispatching during heating season is not effective. In 2017, the coal reduction mission of enterprises above designated size only achieved 66.78% of the target.
Xi'an City will sign the "coal to electricity, coal to gas" transformation agreement as a task to complete the transformation, reported to reduce the distortion of loose coal data. Xixian New District, Liquan County, Xianyang City, Weinan City, Han City and other places falsely reported, falsely reported that "coal to electricity, coal to gas" to complete the task, part of the loose coal reduction "nothing."
Shaanxi Meixin Industrial Investment Co., Ltd. did not strictly implement the capacity substitution requirements in accordance with the rectification plan, and increased the production capacity without authorization. The annual production capacity of 300,000 tons of electrolytic aluminum without the formalities of compliance was expanded to 450,000 tons. Weinan City and Heyang County condone the construction of the Virgin Lake in violation of laws and regulations, destroying nearly 3,000 mu of wetlands. After the State “Green Shield Action” pointed out the problem, the local area used “natural recovery” as an excuse, and the related restoration and repair work was stagnant.
In addition, the inspector found that Xianyang City recognized that the amount of coal used by Datang Binchang Power Plant in 2017 increased by 410,000 tons compared with the previous year, but the actual increase was 600,000 tons. Weinan City confirmed that Shaanxi Jiaojia Chemical Company reduced coal by 19,000 tons in 2017, but the actual increase was 300,000 tons.
The Tongchuan Municipal Development and Reform Commission approved four companies, including Shengwei Building Materials and Shengwei Special Cement, to cut 170,000 tons of coal in 2017, but it did not actually increase 180,000 tons. From January to September 2018, Xianyang Chemical Industry Co., Ltd. did not reduce coal consumption, and asked the government to coordinate coal reduction targets in the name of heating and protecting people's livelihood, resulting in adverse social impacts.
Zhu Zhixin said that there are more than 130 small thermal power units of less than 100,000 kilowatts in Shaanxi Province, which have high coal consumption and high pollution. However, the attitude of shutting down small thermal power units is not determined, and the promotion is weak. From 2015 to 2017, only 7 small units will be phased out. The unit, most of the high coal consumption units are reserved in the name of heat supply or comprehensive utilization, and the existing small units for heating generally fail to implement “heat setting” according to requirements.
The inspector found that the small boiler demolition work in the Guanzhong area of Shaanxi was slow to advance. At present, there are still 607 coal-fired boilers of 10 steam/ton or less that have not been removed, and 26 coal-fired boilers of 20 steam/ton or more have not yet completed ultra-low emission conversion. 414 sets of production and operation type gas boilers have not completed low-nitrogen combustion reform. Yulin City violated the air pollution prevention and control action plan. Since 2014, it has built 121 coal-fired boilers with a capacity of less than 10 tons.
The inspector also found that the pollution control and supervision of the coking enterprises in the Han city were not in place, and the corporate environment was illegal. Longmen Coal Chemical Company has long used the bypass flue to discharge coke oven flue gas; Heli Coal Coke Company falsified during the inspection, and lied to complete the work of CDQ reform; Shaanxi Zhonghui Coal Chemical Company VOCs governance actually changed from dispersed emissions to Concentrated emissions. The supervision of the environmental protection departments of Weinan City was weak, and the process waste gas treatment facilities of the Suihua Group were not operating normally for a long time. Shaanxi Province pays insufficient attention to the pollution control of the ceramic industry in Guanzhong area, and the requirements are not strict. The existing ceramic enterprises have low pollution control level and unorganized emissions.
In addition, the distribution of clean coal distribution centers in Baoji and Xianyang is relatively low, which is quite different from the demand; the Qinhan New Town Clean Coal Distribution Center in Xixian New District stores more than 4,000 tons of industrial coal, and there is direct sales behavior. The quality of clean coal is difficult to guarantee. The coal quality supervision work in some areas was not in place. The Hancheng Municipal Market Supervision Bureau did not conduct coal quality monitoring for large coal users and key coal units during the heating season. The Yulin City Quality Supervision Bureau never arranged for the deployment of loose coal quality inspection.
At the feedback meeting, Zhu Zhixin said that Shaanxi Province should focus on promoting the prevention and control of air pollution in the plain, and focus on accelerating the adjustment of industrial energy structure, making overall plans and comprehensive measures to promote the province to win the blue sky defense and achieve high quality development. . According to the law, serious responsibility is pursued, and the problem of dereliction of duty is instructed to further investigate the situation, clarify responsibilities, and be responsible for seriousness, accuracy and effectiveness in accordance with relevant regulations.
Editor in charge: Li Guolei
After having grown by 2.5% in 2018, global copper production is expected to remain essentially unchanged this year, but will grow by 1.9% in 2020, the International Copper Study Group (ICSG) said in its ‘Copper Market Forecast for 2019/20’, released on Monday.
ICSG met with global copper industry stakeholders on May 9 and 10 to discuss key issues affecting the global copper market.
Global mine production increased by 2.5% in 2018, mainly owing to constrained output in 2017 and to an unusually low rate of overall supply disruptions in 2018.
Besides the restart of the Katanga mine in the Democratic Republic of Congo (DRC), no major new copper mine capacity was brought on stream in 2018.
This year, additional output from the start-up of the major Cobre de Panama mine, in Panama, the expansion of Toquepala mine, in Peru, and the commissioning of a few other small to medium mines is expected to be balanced by a significant decline in Indonesian output – owing to the transition of Grasberg to an underground operation and Batu Hijau mine to Phase 7 – and regulatory and taxation issues, which will negatively impact output in Zambia.
For 2020, the ICSG said, additional supply from mines in ramp-up and expansions that started in 2019, together with a recovery in Indonesian output, will support growth of about 1.9%.
REFINED PRODUCTION
Refined production, meanwhile, is expected to increase by around 2.8% this year and by 1.2% in 2020.
In 2018, global refined copper production was constrained by an unusually high frequency of smelter disruptions and temporary shutdowns for technical upgrades and modernisations.
This year, expanded electrolytic capacity in China, the ramp-up of electrowinning output in the DRC and the recovery from 2018 operational issues and maintenance at smelters in Australia, Brazil, Indonesia and Poland, besides others, will largely offset lower anticipated production at some plants in China and Europe, owing to planned maintenance shutdowns, and lower output in Chile and Zambia, owing to operational issues at smelters.
A rise of 2.8% is expected for this year but, in 2020, planned electrolytic refined production is likely to be constrained by tightness in the availability of concentrates, resulting in a limited increase of 1.2% in world refined production.
After a small decline in 2018, world secondary production from scrap is expected to recover in 2019 and 2020. China will remain the biggest contributor to world refined production growth in both 2019 and 2020.
APPARENT REFINED USE
The ICSG expects world apparent refined copper use to increase by around 2% this year and by 1.5% in 2020.
The organisation stated that sustained growth in copper demand should continue because copper is essential to economic activity and even more so to modern technological society.
Infrastructure development in major countries such as China and India and the global trend towards cleaner energy will also continue to support copper demand.
China will remain the biggest contributor to global growth in copper use. Although underlying “real” demand growth in China is estimated by some analysts to be around 2.6% this year, Chinese apparent demand is predicted to rise by 2%.
The outlook for the European Union and Japan remains sluggish for 2019 and 2020, with demand in the US continuing to rise this year, but levelling off in 2020.
Global use, excluding China, is expected grow by around 1.7% this year and by a further 2% in 2020, mainly supported by increases in the Middle East, India and some other Asian countries.
World refined copper balance projections indicate a deficit of about 190 000 t and 250 000 t for 2019 and 2020 respectively.
Ball bearing searches tick down.
Surge in 'tax air freight tracking' searches from the US. (There's a 14 day window before all the tariffs hit on Chinese exports )
Air freight searches ticking down, but that trend existed prior to the tariff announcement.
Yuan weakening steadily now.
Bitcoin breakout.
Everything about the oversize outsider who surfaced near Norway’s Russian border seemed to confirm he was a Kremlin spy. His demeanor was excessively friendly. The gear he was sporting when detained said, “Equipment—St. Petersburg.” Adding to suspicions, the Kremlin stayed mum.
Norwegian scientists were convinced: The beluga whale stalking boats off the Arctic coast was an operative from the Russian base in Murmansk that trains sea mammals for military missions.
“If this comes from Russia—and there is great reason to believe it—then it is not Russian scientists, but rather the navy that has done this,” Martin Biuw from the Institute of Marine Research in Norway told the country’s national broadcaster.
The harness that the whale was wearing, scientists speculated, could carry a camera or a weapon. The white, SUV-sized mammal was named “Hvaldimir” in an online poll, combining the Norwegian word for whale and the first name of Russia’s president.
Scientists believe that the harness the whale was wearing could carry a camera or a weapon. Photo: jorgen ree wiig/norwegian direct/Shutterstock
Morten Vikeby, a former Norwegian consul in Murmansk, offered a different theory to fishing publication Fiskeribladet: The whale could have escaped from a therapeutic center for underprivileged children who used to pet it and watch it perform tricks.
Wherever the truth lies, behind the spy-whale fever that has gripped Norway is the question of whether Russia is the West’s most cunning adversary or just the one that is best at pushing its buttons.
Share Your Thoughts Should the U.S. and Russia be using sea mammals for military purposes? Why or why not?
With an economy the size of Spain’s and a stretched military, Russia has relied on cheap but high-profile operations that can yield outsize results. They often involve deception aimed at projecting power far greater than the Kremlin actually wields.
The Russian military, when announcing exercises, sometimes adds field kitchens to tallies of vehicles to boost numbers. The army hired far more railcars than it needed for war games in 2017 that made some in the Baltic countries nervous that an invasion was imminent. Russia uses inflatable tank replicas to feign larger formations.
Western analysis—and in some cases, imagination—has at times helped to inflate Russia’s reputation. The Cold War and its aftermath brought decades of trying to divine the workings of the Kremlin and assess the power and strategies of President Vladimir Putin, a former KGB colonel.
A military vehicle is loaded onto an amphibious warfare ship during an exercise in the Murmansk region. The Russian military, when announcing exercises, sometimes adds field kitchens to tallies of vehicles to boost numbers. Photo: Lev Fedoseyev/TASS/ZUMA Press
For the Kremlin, “it’s very important to create an exaggerated sense of Russia’s capacities and the risk of conflict,” said Mark Galeotti, senior associate fellow at the Royal United Services Institute in London.
“If you are already pegged as the schoolyard bully, you want to be the most formidable bully around so no one is going to challenge you, and everyone meekly hands over their lunch money,” he said.
Russia could have sought to soften its image by dismissing the whale story, said Keir Giles, senior consulting fellow of the Russia and Eurasia Program at London-based think tank Chatham House. “By ignoring it, Russia shows it is content to be seen as a state that will take any measures to covertly attack other states, including harnessing innocent sea mammals,” he said.
Russia doesn’t judge an operation’s success by its elegance or stealth, said Mr. Giles. A mission near London in 2018 that U.K. officials said was carried out by Russian military-intelligence officers to murder a former colleague, Sergei Skripal, ostensibly failed. Mr. Skripal survived and the alleged culprits were caught on security cameras and identified.
Instead of hushing-up the incident, Russia flaunted its derring-do by putting the men on state TV. As if to thumb a nose at Britain, they identified themselves as innocent traveling salesmen of sports supplements.
SHARE YOUR THOUGHTS Should the U.S. and Russia be using sea mammals for military purposes? Join the conversation below.
The Skripal affair illustrates the darker side of alleged Russian influence on Western soil—denied by Moscow—from targeted killings to money laundering. But the West tends to fixate on “shiny objects” from Russia, Mr. Giles said, such as social media posts and English-language propaganda channel RT.
And spy-whales. The military training of sea mammals is the kind of program that feeds images of the Russians as comic-book masterminds harnessing the superpowers of animals in pursuit of global influence. State media has drip-fed details of the program in recent years, including a report by the Russian army’s TV channel in 2017 that touted successes in Murmansk training seals, sea lions and beluga whales as “underwater special forces.”
The Kremlin, like the U.S., has for decades sought to use the sonar of sea mammals to spot mines, enemy divers and lost equipment.
Irina Novozhilova, an animal-rights activist who has petitioned the Russian Defense Ministry to end its use of sea mammals, says the military usefulness of dolphins and whales is also exaggerated.
“It doesn’t matter what you strap on a dolphin,” she said, “it’ll never be James Bond.”
Write to James Marson at james.marson@wsj.com and Thomas Grove at thomas.grove@wsj.com
Corrections & Amplifications
A mission near London in 2018 that U.K. officials said was carried out by Russian military-intelligence officers to murder a former colleague, Sergei Skripal, ostensibly failed. An earlier version of this article incorrectly stated the year of the mission as 2017. (May 11, 2019)
Source: Xinhua| 2019-05-12 21:20:38|Editor: Liangyu
Video Player Close
BEIJING, May 12 (Xinhua) -- China has unveiled "the Implementation Plan for the National Ecological Civilization Pilot Zone (Hainan)," foreseeing comprehensive experiments of ecological civilization system reform to be carried out in the southern island province.
Jointly issued by the General Office of the Communist Party of China (CPC) Central Committee and the General Office of the State Council, the document vows to bring about a new pattern of harmonious coexistence of man and nature in China's modernization drive and write a chapter of Hainan for building a Beautiful China.
The pilot zone aims at reaching world leading level in terms of environmental quality and resource utilization efficiency, according to the plan.
The zone will focus on developing a system for building an ecological civilization, optimizing spatial distribution of land, coordinating development and conservation of land and sea, improving environmental quality and resource utilization efficiency, realizing ecological products' values, promoting green production modes and lifestyle, and other aspects of exploration.
(Photo : Pixabay)
Engineers from Washington State University have developed a replacement for Styrofoam. The material is plant-based and is environmetnally-friendly.
Nanocrystals of cellulose comprise the foam. Cellulose is the most abundant plant material on earth. The foam can be produced through a simple and environmentally-friendly process with the use of water instead of other chemicals as solvents. The findings of the study have been published in the journal Carbohydrate Polymers.
The team is led by Amir Ameli, assistant professor in the School of Mechanical and Materials Engineering, and Xiao Zhang, associate professor in the Gene and Linda School of Chemical Engineering and Bioengineering.
Petroleum-based styrofoam is the material used in building and construction, coffee cups, transportation, and packaging industries. However, it uses toxic ingredients as its raw material, needs to be degraded in an artificial manner, uses petroleum, and produces toxic gases when burned.
Other scientists exerted effort in other cellulose-based foams. However, their performance is not at par with Styforoam.
"In their work, the WSU team created a material that is made of about 75 percent cellulose nanocrystals from wood pulp. They added polyvinyl alcohol, another polymer that bonds with the nanocellulose crystals and makes the resultant foams more elastic. The material that they created contains a uniform cellular structure that means it is a good insulator. For the first time, the researchers report, the plant-based material surpassed the insulation capabilities of Styrofoam. It is also very lightweight and can support up to 200 times its weight without changing shape. It degrades well, and burning it doesn't produce polluting ash," according to Nanowerk.
"We have used an easy method to make high-performance, composite foams based on nanocrystalline cellulose with an excellent combination of thermal insulation capability and mechanical properties," Ameli said. "Our results demonstrate the potential of renewable materials, such as nanocellulose, for high-performance thermal insulation materials that can contribute to energy savings, less usage of petroleum-based materials, and reduction of adverse environmental impacts."
"This is a fundamental demonstration of the potential of nanocrystalline cellulose as an important industrial material," Zhang said. "This promising material has many desirable properties, and to be able to transfer these properties to a bulk scale for the first time through this engineered approach is very exciting."The researchers are now developing formulations for stronger and more durable materials for practical applications. They are interested in incorporating low-cost feedstocks to make a commercially viable product and considering how to move from laboratory to a real-world manufacturing scale.
ارتفعت إيرادات محطتي البضائع العامة والحاويات بميناء صلالة بنسبة 23% و 3% على التوالي في الربع الأول من عام 2019، وتعاملت محطة البضائع العامة مع 4.234 مليون طن من البضاعة العامة بالربع الأول من العام الجاري، بزيادة قدرها 3% مقارنة بالربع الأول من عام 2018.
وتمثلت السلع الرئيسية التي تم التعامل معها في الحجر الجيري والجبس والميثانول والاسمنت، حيث يتم تصديرها من صلالة إلى الأسواق المجاورة، والتي تشكل المحرك الرئيسي لأعمال المحطة. فيما انخفضت أحجام الحاويات المناولة بالميناء إلى 912 ألف حاوية نمطية خلال الربع الأول من 2019 وبنسبة 12%، مقارنة بـ 1.032 مليون حاوية للفترة المماثلة من 2018. وعزت شركة صلالة لخدمات الموانئ هذا الهبوط إلى النقص الحاصل في الطاقة الاستيعابية المتاحة بسبب تأثيرات إعصار «مكونو» العام الماضي.
وفيما يتعلق بالإنتاجية قالت الشركة إن محطة الحاويات سجلت ارتفاعا طفيفا في حركات الرصيف خلال ساعة واحدة بالربع الأول من 2019، مؤكدة على تركيزها لتحسين مستويات الإنتاجية. وبلغت الأرباح الصافية مجتمعة للشركة 1.625 مليون ريال خلال الربع الأول من العام الحالي، مقارنة بـ 1.720 مليون ريال للفترة نفسها من 2018.
وسجلت المدخولات قبل خصم الضرائب والفوائد والاستهلاك 4.523 مليون ريال للربع الأول من 2019. وأوضحت الشركة أن تسهيلات محطة الحاويات ما زالت تواجه نقصا في القدرة التشغيلية الآمنة بسبب إجراءات تقييم الأضرار وصيانة المعدات وإعادتها لحالتها الأولى التي تعرض لها الميناء جراء إعصار «مكونو»، ووصلت النفقات الإجمالية خلال الربع الأول من عام 2019 إلى 1.165 مليون ريال والتي تتضمن التكاليف المتعلقة بالإعصار ، ولا تزال عملية دراسة مطالبات التأمين جارية.
وثيقة التأمين وأكدت الشركة على استقرار أعمال الشحن الإقليمية والتي تشكل العمود الفقري لمحطة الحاويات بميناء صلالة، حيث لا تزال المحطة تعمل ضمن طاقتها الاستيعابية الآمنة المنخفضة نتيجة لتأثيرات الإعصار، ومن المتوقع أن تتم العودة إلى مستويات الطاقة الاستيعابية الأصلية في الربع الثالث من العام الجاري، مع توقع استكمال الصيانات وتسليم المعدات، كما أن إدارة الميناء تعمل بشكل نشط مع الزبائن الحاليين والمحتملين لملء الزيادة في الطاقة الاستيعابية. وما زالت أعمال محطة البضائع العامة مستقرة وقد لوحظ ثبات منحنى النمو في صادرات البضائع المجمعة بالربع الأول من 2019 مقارنة بنفس الفترة من العام الماضي.
وقالت الشركة إن المطالبة المالية عن الأضرار التي ألحقها الإعصار «مكونو» أدت إلى عدم تشجيع شركات التأمين الكبرى لتجديد عقد التأمين وإلى زيادة كبيرة في قسط التأمين، وقد تم تجديد وثيقة التأمين الحالية الخاصة بالميناء والتي انتهت بنهاية مارس الماضي، بزيادة على قسط التأمين بمبلغ 2.416 مليون ريال سنويا.
3% respectively in the first quarter of 2019, and handled the general cargo terminal with 4.234 million tons of general cargo in the first quarter of this year, an increase of 3% compared to the first quarter of 2018. The main commodities dealt with were limestone, gypsum, methanol and cement, exported from Salalah to neighboring markets, which are the main engine of the station's operations. The volume of containers handling the port decreased to 912 thousand TEUs during the first quarter of 2019 and by 12% compared to 1.032 million TEUs for the same period of 2018. Salalah Port Services attributed this decline to the shortage of capacity available due to the effects of hurricane «Mkono» last year.
وأكدت الشركة على أن الإدارة تواصل تنفيذ استراتيجيتها التجارية من أجل تنويع البضائع والسلع. ويواصل الميناء تطوير قاعدته الصلبة والاستفادة من شبكة الربط الحالية وقاعدة زبائنه من أجل دعم تطوير النشاط الاقتصادي. النمو التجاري العالمي وأشارت الشركة إلى أن النمو التجاري العالمي يفقد زخمه نزولا من 4.6% في 2017 إلى 3% في 2018، مع توقعات منظمة التجارة العالمية أن يواصل هبوطه إلى حوالي 2.7% خلال 2019، وقد أرجعت المنظمة هذا الانخفاض إلى التوترات التجارية المتنامية مع تزايد مخاطر فرض تعريفات جديدة واتخاذ إجراءات مماثلة للرد عليها مما يؤثر على النمو التجاري.
وقد بدأت خطوط الشحن تشعر بهذا التأثير على معدلات التجارة الرئيسية بين آسيا وأوروبا، التي انخفضت إلى أدنى مستوى لها خلال 12 شهرا. وقالت الشركة إن المؤشرات العالمية تؤكد أن شركات الشحن تركز على زيادة أحجام أسطولها من السفن مما يتطلب قيام محطات محورية مثل صلالة بالاستثمار في تطوير ورفع مستوى طاقاتها الاستيعابية لتتمكن من مناولة السفن ذات الأحجام الكبيرة بشكل آمن.
The company noted that global business growth is losing its momentum down from 4.6% in 2017 to 3% in 2018, with the WTO forecast that it will continue to decline to about 2.7% by 2019, the و
omandaily
China April crude steel production rises 12.7% y/y - stats bureau + more data
* China April crude steel output rose 12.7% year-on-year to 85.03 million tonnes, according to data released by the National Bureau of Statistics on Wednesday.
* China Jan-April crude steel output up 10.1% y/y at 314.96 mln tonnes - stats bureau
* China Jan-April coke output up 6.5% y/y at 151.84 mln tonnes - stats bureau
* China April coke output up 3.4% y/y at 38.99 mln tonnes - stats bureau
* China April coal output up 0.1% y/y at 294.29 mln tonnes - stats bureau
* China Jan-April coal output up 0.6% y/y at 1.11 bln tonnes - stats bureau
* China Jan-April crude oil throughput up 4.7% y/y at 207.47 mln tonnes - stats bureau
* China April crude oil throughput up 5.1% y/y at 52.1 mln tonnes - stats bureau
* China April power generation up 3.8% y/y at 544 bln kWh - stats bureau
* China Jan-April power generation up 4.1% y/y at 2.22 trln kWh - stats bureau
* China April non-ferrous output up 4.9% y/y at 4.74 mln tonnes - stats bureau
* China Jan-April non-ferrous output up 5.2% y/y at 18.64 mln tonnes - stats bureau
Growth in China’s industrial output slowed more than expected to 5.4 percent in April from a 4-1/2 year high in March, reinforcing views Beijing will have to roll out more stimulus measures as a trade war with the United States intensifies.
Analysts polled by Reuters had forecast industrial output would grow 6.5%, slowing from an unexpectedly strong 8.5% in March.
Fixed-asset investment rose 6.1% in January-April from the same period last year, also lagging expectations, the National Bureau of Statistics said on Wednesday.
Analysts had predicted a 6.4% increase, picking up slightly from 6.3% in January-March.
Private-sector fixed-asset investment, which accounts for about 60 percent of overall investment in China, rose 5.5% in the same period, compared with a increase of 6.4% in the first three months of the year.
Retail sales rose 7.2% in April on-year, the slowest pace since May 2003, sharply down from March’s 8.7% and missing a forecast rise of 8.6%.
The United States escalated a tariff war with China on Friday by hiking levies on $200 billion worth of Chinese goods in the midst of last-ditch talks to rescue a trade deal. China retaliated on Monday, though on a smaller scale.
The U.S. move comes as China’s economy was beginning to show tentative signs of improvement after a flurry of support measures, though analysts had cautioned it was too early to call a recovery.
Economists at Citi estimate the U.S. tariff increase could lop 50 basis points off China’s GDP growth, reduce exports by 2.7 percent and cost the country another 2.1 million jobs, though they are optimistic a trade deal will be reached eventually.
Looking today at week-over-week shares outstanding changes among the universe of ETFs covered at ETF Channel , one standout is the Gold Miners ETF (Symbol: GDX) where we have detected an approximate $104.2 million dollar outflow -- that's a 1.1% decrease week over week (from 436,702,500 to 431,702,500). Among the largest underlying components of GDX, in trading today Newmont Goldcorp Corp (Symbol: NEM) is trading flat, Barrick Gold Corp. (Symbol: GOLD) is up about 0.8%, and Franco-Nevada Corp (Symbol: FNV) is up by about 1%. For a complete list of holdings, visit the GDX Holdings page » The chart below shows the one year price performance of GDX, versus its 200 day moving average:
Looking at the chart above, GDX's low point in its 52 week range is $17.28 per share, with $23.70 as the 52 week high point - that compares with a last trade of $20.93. Comparing the most recent share price to the 200 day moving average can also be a useful technical analysis technique -- learn more about the 200 day moving average »
Exchange traded funds (ETFs) trade just like stocks, but instead of ''shares'' investors are actually buying and selling ''units''. These ''units'' can be traded back and forth just like stocks, but can also be created or destroyed to accommodate investor demand. Each week we monitor the week-over-week change in shares outstanding data, to keep a lookout for those ETFs experiencing notable inflows (many new units created) or outflows (many old units destroyed). Creation of new units will mean the underlying holdings of the ETF need to be purchased, while destruction of units involves selling underlying holdings, so large flows can also impact the individual components held within ETFs.
Click here to find out which 9 other ETFs experienced notable outflows »
The PMI index of non-hydrocarbon private sector companies in Qatar recently confirmed an increase in new business volumes at the beginning of the second quarter of 2019. At the same time, the level of confidence for future production reached its third strongest level since the start of the study in April 2017.
More than three-quarters of participating companies expected their business units to grow over the next 12 months, although the index fell slightly from March, but growing demand for new businesses bolsters the companies' optimistic outlook for overall future business activity.
Qatar's main PMI fell slightly from 50.1 points in March to 48.9 in April. Although the recent reading recorded 48.6 points in the last quarter of 2018 above the average, it was below the trend of the first quarter of 2019 (49.7 points). The monthly decline in the PMI index mainly reflects slower growth in new orders and lower production as well as employment indicators.
.
lusailnews
Cass Freight Index Report
Negative Shipment Volume Hits Five Months in a Row Economic Contraction or Only Retrenchment?
April 2019 Year-over-year change 2 year stacked change Month-to-month change Shipments 1.194 -3.2% 6.6% -0.3% Expenditures 2.909 6.2% 19.8% 0.7% Continued decline in the Cass Freight Shipments Index continues to concern us:
• When the December 2018 Cass Shipments Index was negative for the first time in 24 months, we dismissed the decline as reflective of a tough comparison. When January 2019 was also negative, we again made rationalizations. Then February was down -2.1% and we said, “While we are still not ready to turn completely negative in our outlook, we do think it is prudent to become more alert to each additional incoming data point on freight flow volume, and are more cautious today than we have been since we began predicting the recovery of the U.S. industrial economy and the rebirth of the U.S. consumer economy in the third quarter of 2016.”
• When March was down -1.0%, we warned that we were preparing to ‘change tack’ in our economic outlook.
• With April down -3.2%, we see material and growing downside risk to the economic outlook. We acknowledge that: all of these still relatively small negative percentages are against extremely tough comparisons; the two-year stacked increase was 6.6% for April; and the Cass Shipments Index has gone negative before without being followed by a negative GDP. We also submit that at a minimum, business expansion plans should be moderated or have contingency plans for economic contraction included.
• The initial Q1 ’19 GDP report of 3.2% suggests the economy is growing faster than is reflected in the Cass Shipments Index. Our devolvement of GDP explains why the apparent disconnect is not as significant as it first appears.
• The weakness in spot market pricing for many transportation services, especially trucking, is consistent with the negative Cass Shipments Index and, along with airfreight and railroad volume data, heightens our concerns about the economy and the risk of ongoing trade policy disputes.
Consumer appliance manufacturers in China are moving production outside the country to avoid exposure to the China-US tariff disputes, altering aluminium and other metal supply chains, market sources said Wednesday.
Panasonic has moved production of car air conditioning units to Thailand and Malaysia from China, while Daikin plans to move some aluminium compressor production to Thailand, the companies said.
Key Chinese home appliance producers are relocating capacities too, China Household Electrical Appliance Association said Wednesday.
The tariffs would affect air conditioning units, refrigerators and washing machines exported from China to the US in the near term.
"It is like the whole of China coming to Vietnam," a Hanoi-based trader said.
Relocation is not happening as fast as companies had hoped. Daikin is only moving some aluminium compressor production, and other components will continue to be made in China, a company spokeswoman said.
Production transfers need to satisfy an internal standard called 4M, covering method of production, worker skills, material, and management, a Daikin source said.
Some consumer products do not allow switches in raw materials without being tested by the final end-users, and the first step of relocation would be changing delivery destination of raw materials. Shipping has become congested as companies are rerouting container deliveries to Southeast Asia, sources said.
"Due to constraints in logistics, relocation has been slow," an aluminium consumer source said.
Home appliances use devices made of aluminium foil condensers.
"The trade tensions are hitting Japanese device exports, mostly to China, and aluminium condenser demand used for the devices," a Japanese trader said.
Condensers are made of aluminium of 99.7% or higher purity.
Japan's aluminium foil shipments to condenser makers were 7,343 mt in the first quarter, down 9.7% year on year, the Japan Aluminium Association said.
China’s environment ministry has deployed nearly 1,000 inspectors to 25 cities and provinces across the country for its first round of “intensified anti-pollution inspections”.
The checks will focus on 26 environmental aspects, including potable water protection, solid waste imports, urban sewage renovation and water pollution improvement alongside Yangtze River regions.
A total of 981 inspectors were sent to key anti-pollution regions such as Beijing-Tianjin-Hebei, Shanxi-Shaanxi-Henan (known as Fenwei plain) and Yangtze River Delta regions, according to a statement published on the website of the Ministry of Ecology and Environment (MEE) earlier this week.
That came as the ruling Communist Party last year vowed to impose limits on the number of central government inspection campaigns directed at local authorities.
The environment ministry has previously launched several rounds of inspections in 27 different forms.
The intensified checks starts from May 15 and will run until May 25, with an aim to help local authorities to identify problems that require improvement. The same group of inspectors will revisit the regions between September and October to check if the problems have been solved.
“Inspectors will reduce meetings and paper works during the intensified checks, in order to improve efficiency and avoid repeatedly disturbing normal work of local authorities,” said Cao Liping, director of ecological regulation enforcement bureau at the MEE, at its monthly news briefing in April.
Meanwhile, the MEE has also carried out a fresh round of checks on air pollution from May 8, focusing on 39 cities in Beijing-Tianjin-Hebei and Fenwei plain.
A majority of the 39 cities failed to meet their anti-smog targets over the past winter.
“We will hold accountability of local officials in the region missing the targets and send inspectors and experts to help them improve air quality,” said Liu Youbin, MEE spokesman, at the news briefing.
China set mandatory renewable power quotas for each of its region for 2019 and 2020, the National Energy Administration (NEA) said on Wednesday, in an attempt to promote the use of clean energy in the country.
Local grid companies will have to purchase a certain volume of electricity from renewable energy generators, the NEA said.
The targets, setting as a portion of renewable energy use in total energy mix, vary from 10% in eastern province of Shandong to as high as 88% in southwestern province of Sichuan in 2019 based on their energy structure.
The draft plan was launched in November.
Apart from checks from local authorities, central government will also deploy inspectors to monitor the implementation of the policy, the NEA statement said.
China’s state media signaled a lack of interest in resuming trade talks with the U.S. under the current threat to escalate tariffs, while the government said stimulus will be stepped up to buttress the domestic economy.
Without new moves that show the U.S. is sincere, it is meaningless for its officials to come to China and have trade talks, according to a commentary by the blog Taoran Notes, which was carried by state-run Xinhua News Agency and the People’s Daily, the Communist Party’s mouthpiece. The Ministry of Commerce spokesman said Thursday he had no information about any U.S. officials coming to Beijing for further talks.
The indications that negotiations are paused will focus attention on the next opportunity for Presidents Xi Jinping and Donald Trump to meet -- at the Group of Twenty meeting in Japan next month. Their meeting in Argentina in December last year put negotiations back on track, only for them to fall apart again this month in Washington.
"If the U.S. doesn’t make concessions in key issues, there is little point for China to resume talks," said Zhou Xiaoming, a former commerce ministry official and diplomat. "China’s stance has become more hard-line and it’s in no rush for a deal" because the U.S. approach is extremely repellent and China has no illusions about U.S. sincerity, he said.
No Rush for a Deal
According to Zhou, the commerce ministry spokesman on Thursday effectively ruled out talks in the near term. In comments to the media, ministry spokesman Gao Feng said that China’s three major concerns need to be addressed before any deal can be reached, adding that the unilateral escalation of tensions in Washington recently had “seriously hurt" talks.
U.S. Treasury Secretary Steven Mnuchin said this week that American officials “most likely will go to Beijing at some point” in the near future to continue trade talks, before later saying he has “no plans yet to go to China.”
On Friday, China’s government said that it will work to counteract the effects of more U.S. tariffs and keep the economy in a "reasonable range." The National Development and Reform Commission is studying the impact of U.S. tariffs and will roll out "responsive measures when necessary," spokeswoman Meng Wei said at briefing in Beijing.
A sharper and more aggressive tone in state media doesn’t rule out short-term progress in trade talks, as rhetoric can be dialed back just as quickly. However, after months of downplaying the dispute with the U.S. and banning the phrase "trade war," the new strident tone of coverage is striking.
The U.S. has been talking about wanting to continue the negotiations, but in the meantime it has been playing “little tricks to disrupt the atmosphere,” according to the Taoran commentary on Thursday night, citing Trump’s steps this week to curb Chinese telecom giant Huawei Technologies Co.
“We can’t see the U.S. has any substantial sincerity in pushing forward the talks. Rather, it is expanding extreme pressure,” the blog wrote. “If the U.S. ignores the will of the Chinese people, then it probably won’t get an effective response from the Chinese side,” it added.
The Shanghai Composite Index was 1.7% lower at 1:38 p.m. in Shanghai, putting it on course for a fourth week of losses, the worst streak in 10 months. The offshore yuan had weakened more than 0.4% to 6.9395 per dollar.
The blog reiterated China’s three main concerns for a deal are tariff removal, achievable purchase plans and a balanced agreement text, as first revealed by Vice Premier Liu He. They mark the official stance as much as the will of the Chinese public, it wrote.
“If anyone thinks the Chinese side is just bluffing, that will be the most significant misjudgment” since the Korean War, it said.
In addition to putting the Taoran commentary on WeChat, the People’s Daily newspaper had three defiant articles on the trade war in the physical newspaper Friday.
A front page commentary from the Communist Party’s propaganda department headlined ‘No Power Can Stop the Chinese People from Achieving Their Dream’ said “the trade war will not cripple China, it will only strengthen us as we endure it,” citing the hardships China has overcome from the Opium War to floods to the SARS epidemic in 2002-2003.
There were two editorials on page three, with one saying “China doesn’t intend to change or replace the U.S., and the U.S. can’t dictate to China or hold back our development.” The other said claims from some officials in the U.S. that they have “rebuilt” China over the past 25 years are “outrageous” and shows their vanity, ignorance and distorted mentalities.
https://www.bloomberg.com/news/articles/2019-05-17/china-not-interested-in-talking-with-u-s-for-now-state-media
قال سفير ايران لدى نيودلهي علي جكيني: إن الجمهورية الاسلامية الايرانية طرف موثوق به قادر على توفير الطاقة للهند، مؤكداً أن الهند لا تتجاهل هذا الواقع.
وفي تصريح له لصحيفة (إينديا تايمز)، أضاف جكيني: ان الهند ستتخذ قرارها بشأن استيرادها النفط وفق أمنها القومي وحاجتها الى الطاقة، مشيراً الى العلاقات الثنائية بين البلدين والمشتركات الممتدة الى قرون سابقة.
واعتبر سفير ايران لدى نيودلهي الحظر المتفرد الأمريكي نقضاً لسيادة وحرية الدول المستقلة، لافتاً الى حق ايران في تصدير النفط وإلى عدم استطاعة أي طرف منعها عن تصدير النفط.
وتطرق جكيني، خلال المقابلة، الى مواصلة التعاون بين ايران والهند في تنمية ميناء جابهار، وقال: إن الكثير من الدول راغبة في الاستثمار في جابهار نظراً لإيلاء ايران أولوية لذلك.
وأعرب عن اعتقاده بأن الهند لاعبة مركزية في الساحة الدولية وفي المنطقة وقادرة على توظيف آلية الدبلوماسية والحل السلمي لحث الدول على إقامة العدالة. وتعتبر الهند بعد الصين ثاني أكبر بلد يشتري النفط من ايران، حيث بلغ حجم النفط الذي إشترته من ايران الى 24 مليون طن حتى نهاية العام المالي في 30 مارس
al-vefagh
Four commercial vessels were targeted by "sabotage operations" near the territorial waters of the United Arab Emirates, the UAE foreign ministry said in a statement on Sunday, adding that there were no victims.
"Subjecting commercial vessels to sabotage operations and threatening the lives of their crew is considered a dangerous development," the ministry said in a statement that was tweeted by the official news agency WAM.
Saudi Arabia's Energy Minister Khalid al-Falih said on Monday that two Saudi oil tankers were targeted on Sunday in "a sabotage attack" off the coast of Fujairah, part of the United Arab Emirates, threatening the security of global oil supplies.
Iran's response:
In response, Iran's foreign ministry spokesman Abbas Mousavi called the incidents “worrisome and dreadful”, and asked for an investigation into aspects of the matter.
Mousavi was cited by the semi-official ISNA news agency as saying “such incidents have negative impact on maritime transportation security”, and asking for regional countries to be “vigilant against destabilizing plots of foreign agents."
U.S. refiners had a plan for 2020: use their complex operations to maximize profits by making products that would comply with new international laws capping sulphur content in shipping fuels.
But after a series of unexpected market moves, heavy, sour crude oil processed by U.S. refiners has become more expensive, eating up hoped-for profit windfalls before they even materialized, forcing refiners to rethink plans to invest more in heavy crude processing units.
New regulations by the International Maritime Organization (IMO) will require ships globally to use fuels with a sulphur content below 0.5% beginning in 2020. Current shipping fuel is much dirtier, with a higher sulphur content.
The move was expected to make heavy crude oil cheap as most refiners worldwide shifted to lighter crudes that yield compliant lower-sulphur fuels - and benefit complex U.S. refiners that possess greater capability to break down that heavy crude into high-margin products.
Instead, global heavy crude supplies have become scarce due to sanctions on Venezuela, one of the world’s biggest heavy producers, pipeline bottlenecks in Canada and OPEC output cuts. The Organization of the Petroleum Exporting Countries’ April output fell to 30.23 million barrels per day (bpd), the lowest since 2015.
“The biggest single factor is the big loss of heavy crude,” said Todd Fredin, executive vice president of supply, trading and logistics at Motiva Enterprises, which operates a 603,000 bpd operation in Port Arthur, Texas, the largest U.S. refinery. The benefit to complex refiners from the regulatory change “is going to be less than people thought,” he said.
Heavy crude once fetched a big discount compared with light crude, but it has narrowed after sanctions on Iran and Venezuela. That weighed on first-quarter earnings for major independent refiners Valero Energy Corp and Phillips 66 .
Marathon Petroleum Corp this week halted plans to add a coking unit to its Garyville, Louisiana refinery that would have processed more heavy crude. Marathon said the coker, which was expected to come online in 2021, was no longer financially viable due to narrowed spreads.
U.S. refiners rely on cokers to break down residual oils into other refined products, including gasoil and naphtha. Refineries without that capability typically process more light crude, produced in abundance by the United States, versus heavy crude, which U.S. refiners have to import.
The price difference between U.S. Gulf Coast grades Louisiana Light Sweet (LLS) and Mars, the best proxy for comparing light, sweet and heavy, sour crude in the U.S. Gulf, has narrowed in the last few months.
LLS’s premium over Mars on Thursday was $2.05 per barrel, compared to $4.25 per barrel in mid-November, according to Refinitiv Eikon data. At one point in February, Mars traded at a premium to lighter LLS, the first time that has happened since 2011.
Some analysts said crude volumes processed may have to be cut, but so far that has not happened. “We really see the narrowing of the spreads to be a short-term issue,” Marathon Chief Executive Gary Heminger told Reuters, saying the company is keeping their existing coking units full.
Prices of heavy crude will likely remain high as traditional heavy suppliers like Canada and Mexico grapple with infrastructure and production constraints, said Michael Tran, an analyst at RBC Capital Markets.
“There’s not many countries that can step up to the plate” to make up for the loss, he said.
Oil refiners across Asia are bidding up crude prices from Abu Dhabi to Oman as they compete for supplies to make up for lost Iranian and Venezuelan exports.
July-loading cargoes of grades such as Murban and Das were bid at premiums of $0.80 to $0.85/bbl above the official selling price on Friday on an electronic trading platform operated by S&P Global Platts. That would be the highest spot differentials in at least three years for the grades, according to data compiled by Bloomberg. Upper Zakum crude was also bid at a $0.65 premium, while Umm Lulu changed hands at a $0.95 premium. The higher bids came even after Abu Dhabi National Oil hiked the official price of its crude earlier this week.
Buyers across the world’s top oil-importing region are scrambling for oil as U.S. sanctions on Iran and Venezuela tighten supplies of high-sulfur crude that their refineries are designed to process. Unplanned disruptions to Russian and Nigerian flows and concerns that fighting in Libya could affect oil exports also contributed to the fervor to secure cargoes.
Oman crude futures climbed to a premium of $3.10/bbl over swaps for Dubai oil, the benchmark grade for the Middle East. That’s its highest premium since September, when markets were spooked by the prospect of U.S. sanctions putting an end to Iranian exports.
A wide discount between the Dubai benchmark and Brent, the marker for more than half the world’s oil supplies, is also contributing to the strong interest for Middle Eastern grades. Dubai’s discount to Brent futures was more than $3/bbl on Friday, near the highest level in seven months.
Investor Drexel Hamilton Infrastructure Partners LP and rail operator Rio Grande Pacific Corp on Friday disclosed plans to build a $1.5 billion rail line that would transport heavy crude from Utah to connections to the U.S. Gulf Coast.
Drexel Hamilton and Rio Grande officials said the project aims to deliver about 400,000 barrels per day (bpd) of Uinta basin crude to Gulf Coast refineries looking to replace heavy oil supplies from Venezuela.
“The Uinta has only been restricted from Gulf Coast and overseas refiners as a result of limited takeaway capacity,” said Mark Michel, a managing partner at private equity fund Drexel Hamilton. “We are going to change that.”
Uinta Basin oil now is trucked to Salt Lake City refineries because it is too thick to put into a pipeline, Robert Bach, president of Rio Grande said in an interview. “This (Gulf Coast) market is much bigger.”
The proposed project would include at least one terminal able to load crude onto trains and to receive sand used in hydraulic fracturing. The rail line will be contingent on receiving commitments from oil producers, Bach said.
The Seven County Infrastructure Coalition, a Utah regional planning group, on Friday approved terms of a preliminary agreement with Drexel Hamilton to build the railroad.
Rio Grande owns four short-line railroads in Texas, Louisiana, Oklahoma and other states. The proposed rail line would extend 80 miles between connections with Union Pacific and BNSF Railway near Soldier Summit, Utah and potential terminal locations in the Uinta basin near U.S. oil producers.
“There was never enough momentum behind this before,” Bach said, explaining that U.S. sanctions on Venezuela’s state-run PDVSA oil company, a former major supplier of heavy crude to the U.S., helped spur demand.
The U.S. Coast Guard said on Saturday it’s too early to estimate when the Houston Ship Channel can reopen after a collision that spilled about 9,000 bbl of a gasoline ingredient into the water.
Friday’s collision involved the tanker Genesis River and a tug transporting two barges carrying more than 2 million gallons of reformate, an oil-refining byproduct used to make gasoline. One barge capsized and the other was damaged following the incident that occurred 2 1/2 mi east and south of the Bayport terminal.
“Our objective today is to secure the vessels,” U.S. Coast Guard Captain Kevin Oditt told reporters. “Once we have those vessels secured, we will work with the pilots and we will evaluate whether we can reopen the ship channel.”
The Houston Ship Channel is the city’s lifeline to the Gulf of Mexico and to foreign markets. Oil shippers, refiners, chemical manufacturers and grain exporters rely on the waterway to receive and deliver everything from crude to corn.
The Coast Guard established an emergency temporary safety zone and closure of the Clear Creek Channel from the entrance to Clear Lake extending east to Light 66 and north up to but not including the Bayport Ship Channel, it said in a statement. The area between Light 61 and Light 75 was also shut.
The spill was pinpointed by the National Weather Service as a possible source of the gasoline-like scent wafting across Houston’s eastern suburbs. Teams of air monitors were working around the clock to assess levels.
“To date, those teams have taken over 1,300 samples and, in all cases, the samples taken have not exceeded the established action levels,” said Craig Kartye of the oil spill prevention and response program at the Texas General Land Office.
About 3,600 ft of boom has been put in place and efforts are underway to deploy an additional 12,000 ft in the most pressing areas, said Jim Guidry, executive vice president of vessel operations for Kirby Inland Marine, operator of the tug involved.
While one of the barges has lost about 9,000 bbl of reformate, the capsized vessel hasn’t leaked any cargo at this time, he said.
“We are continuing to work with the Coast Guard and the other federal regulators to understand the cause of the incident and will be working to recover any of the spilled product and mitigate the impact on the environment,” Guidry said.
Norwegian oil and gas player Aker BP has failed to find hydrocarbons after drilling a wildcat well in the North Sea offshore Norway.
The Norwegian Petroleum Directorate (NPD) said that the well 25/11-29 S was drilled on the Utsira High, about 14 kilometers south of the Grane field and 190 kilometers west of Stavanger in the central part of the North Sea.
The primary exploration target for the well was to prove oil in reservoir rocks of Early Jurassic age in the Statfjord group. The secondary exploration target was to prove oil in reservoir rocks of Paleocene age in the Heimdal formation.
The well encountered the Statfjord group with a thickness of about 100 meters, of which 65 meters is reservoir rocks with good reservoir quality. The well did not encounter the Heimdal formation. The well is classified as dry. Extensive data acquisition and sampling have been carried out.
It is worth noting that this is the first exploration well in production license 916 which was awarded in APA 2017.
The NPA added that the well was drilled to vertical and measured depths below the sea surface of 2,233 and 2,283 meters respectively, and was terminated in the Zechstein group of Permian age. The well will be permanently plugged and abandoned.
Well 25/11-29 S was drilled by the Deepsea Stavanger drilling rig, which will now proceed to production license 777 in the central part of the North Sea to drill wildcat well 15/6-16 S, where Aker BP is the operator.
Spotted a typo? Have something more to add to the story? Maybe a nice photo? Contact our editorial team via email. Offshore Energy Today, established in 2010, is read by more than 10.000 industry professionals daily.
We had almost 9 million page views in 2018, with 2.4 million new users. This makes us one of the world’s most attractive online platforms in the space of offshore oil and gas.
These stats allow our partners advertising on Offshore Energy Today to get maximum exposure to their online campaigns. If you’re interested in showcasing your company, product or technology on Offshore Energy Today contact our marketing manager Mirza Duran for advertising options.
A tiny South American country until recently known mostly as the location of one of the worst mass suicides in modern history is about to acquire a whole new reputation, and this reputation has to do with its oil wealth.
Guyana, sandwiched between Venezuela and Suriname, has in just a couple of years turned from an empty spot on the international oil map into one of the new hot spots thanks to a series of discoveries offshore, made by Exxon and Hess Corp.
The Stabroek block is the place where the discoveries were made. The first ones came in 2015 and since then, Exxon has been announcing new ones on a more or less regular basis. To date, there have been 12 discoveries, with the reserves associated with them topping 5 billion barrels of oil equivalent.
This is certainly a lot of oil and it could either solve all economic problems of the tiny nation of less than a million people or, as history has sadly proved more than once, become an oil curse. It would all depend on how Guyana handles its future oil wealth.
The BBC’s Simon Maybin noted in an analysis of Guyana’s changing fortunes this week that the country, a former British colony, currently suffers high unemployment and poverty rates. It also has high levels of corruption—a practice that oil wealth has been found to exacerbate more often than not. The billions of dollars in oil revenues to be had also encourage political instability as more groups vie for power and access—preferably exclusive—to the oil dollars.
Already, sings of this political instability are emerging in Guyana, Maybin reports. The coalition in power lost a no-confidence vote last December, but instead of calling elections, which would have been standard procedure, the coalition challenged the result of the vote in court. This has led to demonstrations and a prolonged legal battle that is still not over.
Guyana’s only hope is if it can somehow manage to put a lid on political ambitions and focus on the actual benefits to be reaped when Exxon and Hess begin commercial production, such as improving the living conditions of the poorest Guyanese and reducing unemployment as well as boosting economic growth. Related: Oil Markets Uncertain As Trade War Counters Supply Shortages
Luckily, Guyana has both good and bad examples to look to. Norway is the best good example of how a nation can use its oil money in a productive way and turn into one of the wealthiest in the world without relying excessively on oil but rather on the smart investments of money from this oil.
And then there’s Guyana’s very own neighbor Venezuela, which is a picture of how it shouldn’t be done, namely by neglecting other sectors of the economy in favor of oil, pouring oil money directly in otherwise good social programs and seeing them crumble along with the economy once oil prices drop. Corruption and the resulting authoritarianism to keep control of the oil money are also among Venezuela’s problems that predate the U.S. sanctions. Now, the country is shaken by a perfect storm that could see its oil production obliterated.
So, the world’s new hot spot could either turn into a new Norway or a new Venezuela, Nigeria, Angola, and a host of other countries for whom oil turned from a blessing into a curse. It seems only time will tell which example the country will follow.
By Irina Slav for Oilprice.com
More Top Reads From Oilprice.com:
TEHRAN - Visiting Research Scholar in the CESP Omid Shokri believes that even with massive inspections the U.S. will not be able to drive Iran’s oil export to zero.
To drive Iran’s oil export to zero, the Trump administration said that it will no longer exempt any countries from U.S. sanctions if they continue to buy Iranian oil, stepping up pressure on Iran in a move that primarily affects the five remaining major importers: China and India and U.S. treaty allies Japan, South Korea, Turkey.
To shed more light on the issue we dissussed it with Omid Shokri Kalehsar a Washington-based Senior Energy Security Analyst.
Here is the full text of our interview with him:
Q: Saudi Arabia and the UAE have announced they will compensate for Iranian oil. Is this possible technically?
A: Supply and demand is an important factor in the international oil market. The oil market needs increased supply from major OPEC members and non-members such as Russia. It seems that Saudi, the UAE and Iraq with Russia must produce more oil to overcome the shortage of Iranian oil in the oil market. At present major importers of Iranian oil are looking to find an alternative to Iranian oil because the U.S. did not extend the waiver for Iran’s major oil buyers. India and South Korea are importing more oil from the U.S. and also imported more US LNG, refineries from these both countries are adapting themselves to U.S. oil, they previously imported Iranian oil and are now ready to import U.S. oil. Some analysts believe that the Saudis will be faced with the major problem of increasing their oil output by as much as a million barrels; Saudi Arabia's oil consumption is rising in the warm months due to increased cooling applications and oil consumption rises from 400 to 500,000 bpd.
It is claimed that the other barrier which Saudi Arabia faces in increasing its crude exports is that the government have invested heavily in their refineries and oil products exports over the past years. A unilateral increase in oil output beyond the quotas could impose a requirement for other OPEC members and even eliminate the agreement between OPEC and 10 OPEC non-member countries.
It will possible for Saudi to increase its crude production in the two months of May and June. Saudi Arabia said the country's oil production in the first quarter of this year would be lower than its country's quota, which would allow the country to increase production in those two months. It should be recalled that calculating the compliance of OPEC member states with their oil production quotas is carried out over a six-month period, and the average monthly production of these countries in this six-month period is the basis for judging their compliance with their quotas.
In this way, Saudi Arabia could offset Iranian oil exports from markets by boosting its oil production over the next two months. The decision on the quota for the second six months of this year (July to December) will be taken at the OPEC Ministerial Meeting in Vienna, held in June. Thus, eliminating Iranian oil does not necessarily increase oil prices in the global markets. Some Iranian officials have also confirmed this.
In respect with the United Arab Emirates, which has been proposed as one of the alternatives to Iran's oil market, the country has a production capacity of 3,300,000 barrels per day; its production in 2002 was 2.56 million barrels per day and in 2018 were 3 million and 34 thousand barrels a day. However, according to the latest OPEC announcement, the UAE's oil production in March 2019 amounted to about 3 million and 59 thousand barrels a day. One million barrels will be provided to domestic refineries, and the rest will also be shipped to the export market.
At present some oil producers such as Libya and Venezuela face tensions and political unrest. Currently, aside from Saudi Arabia and the United Arab Emirates, OPEC has no spare capacity. Of course, the commitment to quotas is an important message for the oil market. On the other hand, OPEC or the Consumers' Union is also seriously concerned. If major consumers such as China, India or Turkey form an oil consumer organization, America will not be able to cope with them. Most of OPEC's Middle Eastern countries have focused on Asian markets because the European market has no horizons and the future of the oil market is developing in Asia. In other words, in the current century, they are the largest producers of Asian oil.
Q: The U.S. is making efforts to drive the export of Iranian oil to zero. Is it possible? If not, why?
A: Even a massive inspection will not prevent the sale of quantities of oil. During the Iraqi oil sanctions, despite the international cooperation in this regard, the country was still able to smuggle some of its oil in various ways, including through neighboring countries. Based on this, the U.S. government largely relied on buyer cooperation and fears of a second-round sanction to curb Iran's oil exports. In terms of the oil market, despite the promise of some exporting countries to compensate for any shortages in the market and OPEC's commitment to maintaining price stability in the oil market, full compensation for Iranian oil exports to its technical specifications is not urgent, and given the special discounts that the Iran gives to some importers, small companies who are less concerned about cutting U.S. financial and trading facilities will continue to buy oil shipments.
Some of Iran's oil production is being shipped to China for storage, and part of it is also transported to tankers for informal sales. It seems that Iran could ship 300 to 650 thousand barrels of oil a day, which will not be sold every day. Selling Iranian oil on the grey market is the only way to keep some Iranian share in the oil market. Iran must sell its oil at a low price to find costumers for its oil, while another problem is how to get money from costumers? Another way is for Iranian officials is to sell Iranian oil in the name of another (third) country.
Q: The U.S. is forcing Turkey to stop buying oil from Iran and replace Saudi and Emeriti oil instead of Iranian oil. What are the advantages of Iranian oil for Turkey?
A: The main question for oil traders and political analysts is how much America wants to test these relationships by crippling the Iranian economy. According to the latest official figures available in January, Iran provided more than 12% of Turkey's oil imports. Iraq held 24 percent of the main supply, and Russia provided 15 percent of Turkey's imported oil. Turkey imported only diesel from the UAE in January, and now Iran is the third largest supplier of crude oil for Turkey. 'Iran's oil is not cheap, but there is a major difference in comparison to the prices of Saudi Arabia and the United Arab Emirates,' Turkish Foreign Minister Mevlut Çavusoglu said in Ankara.
Turkey has always defended its commercial ties with its eastern neighbors and considers it a strategic requirement. Iran's oil could be another source of diplomatic controversy between Ankara and Washington, when relations between them are tense due to Turkey's emphasis on purchasing a missile defense system from Russia. Turkey, after some time, will be able to find alternative for Iranian oil; although Turkey prefers to have energy relations with Iran, it seems that Turkey will decrease oil imports from Iran and they may drop to zero in the medium term.
Omid Shokri Kalehsar is a Washington-based Senior Energy Security Analyst, currently serving as a Visiting Research Scholar in the Center for Energy Science and Policy (CESP) and the Schar, School of Policy and Government at George Mason University.
tehrantimes
The lingering oversupply of vessels in the VLCC market has left shipowners weighing options to either idle, reduce sailing speed extensively or take on only short voyages as freight returns are seen below operating costs.
Stay up to date with the latest commodity content. Sign up for our free daily Commodities Bulletin.
Sign Up The Time Charterer Equivalent or TCE, which is the earnings accrued, for a modern VLCC has slumped to around $7,000/day on key Persian Gulf to North Asia routes, which hardly covers the daily running cost of the vessel, according to market participants.
To tide over the staggeringly low earnings period, two shipowners told S&P Global Platts that they have resorted to drifting their vessels to save fuel cost. When a vessel is made to drift in a safe location, the power to the main engine is switched off to save on fuel expenses.
"It makes no sense for owners to accept further lower freight levels at the current TCE levels," a VLCC owner said.
Some shipowners are contemplating to avoid working on any cargoes until the freight returns improve to levels that would cover the operating expenses.
"With earnings so low, [a few shipowners are] doing short voyages, so that the pain is over a lesser amount of time. Not everyone can afford to stop ships," a shipbroker said.
The current TCE has fallen massively from levels seen in January, when owners pocketed around $40,000/day.
The anemic earnings are a result of the early onset of the Asian refinery turnaround season along with the slowdown in US crude exports as well as the flood of newbuilding VLCCs during the first quarter of the year.
So far this year 20 new vessels have been added to the VLCC fleet out of the estimated delivery of 54 ships with fewer vessels deleted to offset the tonnage growth.
"Initially, owners will slow steam to cut bunker costs. [Owners are running vessels] at 12-12.5 knots for laden and 9-11 knots on the ballast [leg]," a second shipbroker said.
Meanwhile, shipowners are yet to resort to laying-up of vessels, a strategy adopted when freight levels are insufficient to cover the running costs.
"When the earnings is below $5,000/day, the owners will start laying-up the more expensive ships in the fleet," the second shipbroker said.
"People will not do lay-up now, but just not fix and wait. Waiting is cheap at current rates," a second VLCC owner said.
Some shipowners are compelled to keep their vessels running due to their business models, while others are opting to keep their vessels waiting at Fujairah in the Persian Gulf or Galle at Sri Lanka's west coast, market sources said.
"Slow speed is already happening and people just prefer to wait than fix. What you may see soon is a bit more activity on the VLCC scrapping," a third VLCC owner said, adding that "lay-up is not a usual option and is the last resort".
Despite shipowners with modern VLCCs resisting to fix their vessels, the stiff competition from those with "handicapped" ships has allowed charterers to pick tonnage at very cheap freight levels. The ships coming out of dry-dock and with fewer approvals from oil majors or inspections by marine industry forums are termed as handicapped vessels.
Platts assessed the key PG-China rate at Worldscale 36.5 on Thursday, basis 270,000 mt, which is equivalent to $6.87/mt, down by w26.5 from when Platts had assessed the rate of the same route at w63 on January 2.
Russia has begun shipping clean oil via the Baltic after a contamination problem disrupted flows for three weeks and it is working to resume supplies by a pipeline to Europe although traders said this might take several more weeks to fix.
High levels of organic chloride, used in oil extraction but which must be removed before being sent to clients, was found in crude pumped to the Baltic port of Ust-Luga and through the Druzhba pipeline in late April, disrupting Russian exports.
Two trading sources told Reuters the level of organic chloride in oil loading at Ust-Luga was back to normal on Monday, after the contamination halted sales. Two other sources said test oil shipments via Druzhba had started to Hungary.
Russia’s Energy Ministry had said on Friday tankers were being loaded with clean oil at Ust-Luga, after the disruptions to exports through the port and Druzhba pipeline drove up global crude prices and left refiners as far west as Germany scrambling to find alternative crude supplies.
Two industry sources said Hungarian energy company MOL was receiving oil via Druzhba as part of a test to see whether the equipment at its sole Danube refinery could process the oil. High levels of organic chloride damages refinery equipment.
Hungary has become the first European country to resume imports, but one of the sources said the organic chloride content in Hungary’s test supplies was still above permitted levels of a maximum norm of 10 parts per million (ppm).
The sources said MOL hoped to restart regular Druzhba intakes from May 17, once it had carried out the tests.
Ukraine said on Saturday it had resumed transfers to European clients via the pipeline’s southern leg to Slovakia, Hungary and Czech Republic. The pipeline, which splits into two branches in Belarus, has a northern spur routed to Poland and Germany.
The Czech government approved on Monday a second loan from state oil reserves for refiner Unipetrol, part of Poland’s PKN Orlen group, for more than 100,000 tonnes of crude to cover for supply interruptions from Russia.
“ENORMOUS” COST
Belarus plans to discuss the contamination crisis in the Slovak capital of Bratislava on May 13-14, Belarusian state firm Belneftekhim said on Monday.
President Alexander Lukashenko said last week Belarus had faced “enormous” costs due to the contamination and expected compensation from Russia, although the mechanism for any compensation and who will pay remains unclear.
Russian pipeline monopoly Transneft blamed unnamed “fraudsters” for the problem. Russian President Vladimir Putin said Transneft lacked a proper mechanism to prevent contamination.
The issue has driven down Russian oil shipments. About 6% less oil was pumped through Transneft’s pipeline network from May 1 to May 12 compared with April’s average, two sources familiar with the shipment data said.
They said oil intake in Transneft’s nationwide network, which handles about 85% of Russia’s total crude output, was about 8.8 million barrels per day (bpd) in the 12-day period, citing data that included oil used at home and export volumes.
At least 5 million tonnes of oil, or about 36.7 million barrels, was tainted with high levels of organic chloride.
Transneft has proposed mixing tainted oil with the clean crude at the Black Sea port of Novorossiisk. Industry sources said levels of the organic chloride at Novorossiisk had risen since early May but remained below 10 ppm limit.
Total Russian oil production has also slipped this month, declining to 11.16 million bpd from May 1 to May 12 from an average of 11.23 million bpd in April, sources said, the lowest output level since June, when it was 11.06 million bpd.
Russia has agreed with the Organization of the Petroleum Exporting Countries and other producers to lower output to shore up global prices, but its May output has now dipped below the target level allowed in the deal of 11.18 million bpd.
Equinor has acquired an additional 22.45% stake in the Caesar Tonga oilfield in the U.S. Gulf of Mexico from Shell for $965 million in cash, the Norwegian company said on Monday.
The acquisition will increase Equinor’s interest in the deepwater field, operated by Andarko, to 46% percent, giving it an additional 15,000 barrels of oil equivalents per day (boepd).
Its current net production from the field is 18,600 boepd, compared to Equinor’s total U.S. Gulf of Mexico production of 110,000 boepd in the first quarter.
“We are pleased to increase our presence in the United States, one of our core areas,” the head of Equinor’s offshore U.S. production, Christopher Golden, said in a statement.
“This is an asset we understand well, and our larger interest will deliver significant additional free cash flow from day one,” he added.
Later this year, Equinor will drill an exploration well at its Monument prospect, which could further increase the company’s foothold in the area, Golden added.
Andarko has a 33.7 percent interest in Caesar Tonga, while Chevron holds the remaining 20.25 percent.
Only one Indian buyer of Iranian oil has taken up Saudi Arabia’s offer of additional oil to make up for the loss of supplies from Tehran due to U.S. sanctions, taking an extra 2 million barrels from the Kingdom for June shipment, industry sources said.
Last month, Saudi Arabia approached Indian buyers offering them additional supplies to compensate for loss of Iranian oil after the United States threatened to sanction entities buying oil from Tehran, the sources said.
The United States had imposed new sanctions on Iran in November last year, but gave a six-month waiver to eight countries, including India, which allowed them to import some Iranian oil.
India was able to buy about 300,000 barrels per day (bpd) of Iranian oil under the waiver. But last month, Washington ended the waivers and said buyers should stop Iranian oil purchases or face sanctions.
Only state refiners - Indian Oil Corp, Bharat Petroleum Corp, Mangalore Refinery and Petrochemicals and Hindustan Petroleum Corp - accounting for about 60 percent of India’s 5 million bpd refining capacity had purchased oil from Iran since November.
In January-April 2019 India received about 304,500 bpd Iranian oil.
In June, Saudi Arabia will supply an additional 250,000 tonnes (2 million barrels) of oil to Mangalore Refinery (MRPL) on top of its normal requirement of about 320,000 barrels (about 2.5 million barrels), one of the sources familiar with the matter said.
Another source said MRPL might not lift the additional Saudi oil as the refiner had declared force majeure and shut half of its plant due to water shortages.
Mangalore Refinery declined to comment. There was no immediate comment from IOC, HPCL, BPCL and Saudi Aramco.
“In our system, UAE and Iraq oil turned out to be better than Saudi oil,” a source at one of the Indian refineries said.
IOC, BPCL and HPCL have not placed a request for extra Saudi oil for June after the Kingdom raised official selling price for Asia, the sources said.
“Saudi OSPs for June have been very strong, so Indians may have taken extra from others at competitive rates,” said Sri Paravaikkarasu, director for Asia oil at Singapore-based consultancy FGE.
When Iran was under sanctions in 2012, Saudi Arabia and Iraq had raised market share in Asia. But since that time trade routes have shifted with new supplies, including from the United States, coming on to the markets.
“Saudi will have to fill some of the void left by Iran but it will not be a one to one replacement,” Paravaikkarasu said. “Indian refiners’ oil import policy is very flexible now and they are no longer relying on one or two particular producers.”
Indian refiners have raised optional volumes under annual contracts with key producers as well as testing new grades and origins to make up for loss of Iranian oil.
Also, U.S. crude’s widening discount to Brent has strengthened demand for U.S. crude exports.
“India wants to diversify away from Middle East because of lots of geopolitical issues relating to the region,” Paravaikkarasu said. “The Middle East will continue to be the mainstay for Indian refiners but they would like to tap new stable areas when it comes to requirement of incremental barrels.”
U.S. oil output from seven major shale formations is expected to rise by about 83,000 barrels per day (bpd) in June to a fresh peak of about 8.49 million bpd, the U.S. Energy Information Administration said in its monthly drilling productivity report on Monday.
One of the largest changes is forecast in the Permian Basin of Texas and New Mexico, where output is expected to climb by 56,000 bpd to a new record of about 4.17 million bpd in June. That would be the biggest increase since February.
In North Dakota’s Bakken region, production is expected to jump by 16,000 bpd to a record of 1.42 million bpd while in the Eagle Ford, output is expected to slide by about 942 bpd to 1.43 million bpd.
A shale revolution and production increases particularly from the Permian basin and the Bakken have helped make the United States the biggest oil producer in the world, ahead of Saudi Arabia and Russia.
Major oil companies like Exxon Mobil Corp and Chevron Corp are boosting their presence in shale, particularly in the Permian, the largest U.S. shale oil field.
Separately, U.S. natural gas output was projected to increase to a record 80.7 billion cubic feet per day (bcfd) in June, the EIA said. That would be up 0.9 bcfd over the May forecast and mark a fifth consecutive monthly increase. A year ago in June, output was 68.2 bcfd.
The EIA projected gas output would increase in most of the big shale basins in June, except Anadarko in Oklahoma and Texas and Eagle Ford in Texas.
Output in the Appalachia region in Pennsylvania, Ohio and West Virginia, the nation’s biggest shale gas play, was set to rise almost 0.4 bcfd to a record 32.1 bcfd in June. Appalachia production was 27.5 bcfd in June a year ago.
The EIA said producers drilled 1,364 wells and completed 1,407, the most since January 2015, in the biggest shale basins in April, leaving total drilled but uncompleted wells down 43 at 8,390, according to data going back to December 2013.
That was the biggest decline in drilled but uncompleted wells since March 2018 when they fell by 104.
(Bloomberg) -- While the global crude market keeps showing
signs that stockpiles are getting tight, U.S. benchmark futures
are signaling plenty of supply. Contracts for July delivery of
Brent crude are trading at a premium of more than $3 a barrel
above December, doubling from a month ago, while the same spread
for West Texas Intermediate is at about 39 cents. The divergence
comes amid OPEC+ production cuts, and rising geopolitical
tensions from Venezuela to Iran, while surging Permian Basin
production swells inventories at the U.S. storage hub in
Cushing, Oklahoma.
To contact the reporter on this story:
Catherine Ngai in New York at cngai16@bloomberg.net
To contact the editors responsible for this story:
David Marino at dmarino4@bloomberg.net
Sophie Caronello
استكملت شركة سرت بنجاح أعمال الحفر التطويري للبئر (وو03-6) بطبقة القرقاف الغازية في حقل الاستقلال النفطي. وتجدر الإشارة إلى أنّ المؤسسة الوطنية للنفط تقوم بدعم أنشطة الحفر التطويري في قطاع النفط الليبي، وذلك في إطار حرصها على زيادة القدرة الانتاجية للحقول وضمان استمرار تزويد محطات توليد الكهرباء الساحلية باحتياجاتها من الغاز.
وقد تمّت عمليّة اختبار البئر يوم الأحد الموافق 12 مايو 2019، وقد تم حفر هذا البئر باستخدام تقنية سائل آفرون الحديثة للحفر وتحت إشراف شركة الجوف
وكانت النتائج الأولية للحفر مشجّعة:
قطر الخانق: 32/64 بوصة
معدل انتاج المكثفات : 263 برميل /ي
معدل انتاج الغاز : 7.103 م.ق.م/ي
قطر الخانق: 40/ 64 بوصة
معدل انتاج المكثفات: 328 برميل/ي
معدل انتاج الغاز : 11.725 م.ق.م/ي
قطر الخانق: 48/64 بوصة
معدل انتاج المكثفات : 455 برميل /ي
معدل انتاج الغاز : 13.979 م.ق.م/ي
هذا وسيتم استكمال البئر بواسطة أنابيب الإنتاج وملحقات البئر الخاصة والمصممة حسب ظروف المكمن المحدّدة.
وتجدر الإشارة إلى أنّ شركة سرت مسؤولة عن نظام نقل الغاز وأنابيب الغاز الساحلية الممتدّة من بنينة إلى مليته، والتي تنقل الغاز الطبيعي الذي يزوّد المنشآت الصناعية ومحطّات توليد الكهرباء ومحطات تحلية المياه.
طرحت إيران حلولا لتفعيل آلية التعامل التجاري مع أوروبا، والتي تهدف إلى إنقاذ الاتفاق النووي من خلال السماح لطهران بمواصلة التعامل مع الشركات الأوروبية رغم العقوبات الأمريكية. وقال محافظ البنك المركزي الإيراني عبد الناصر همتي، إن أسهل طريقة لتفعيل الآليتين الأوروبية 'إينستكس' والإيرانية 'ساتما'، وهي شركة نظيرة للآلية الأوروبية، تتمثل بقيام الشركات الأوروبية باستيراد النفط من إيران أو منح خط ائتمان للمصدرين الأوروبيين لبدء التصدير إلى إيران.
وانتقد المسؤول الإيراني من خلال تدوينة على 'إنستغرام' نشرها مساء الاثنين تقاعس الجانب الأوروبي في تفعيل آلية التجارة، التي قدمت قبل 3 أشهر من قبل الدول الموقعة للاتفاق النووي وهي فرنسا وبريطانيا وألمانيا. وقال همتي إن 'حديث الأوروبيين عن سعيهم لتفعيل الآلية أصبح عبارة مكررة وبالية'، معتبرا أن الحل الذي قدمه هو الطريقة الأمثل لتفعيل هذه الآلية.
وأضاف: 'إذا كان الأوروبيون قلقين من رد فعل الولايات المتحدة إزاء السلع المصدرة إلى إيران فبإمكانهم اختبار قدرتهم على تصدير السلع الأساسية والأدوية. الآن يمكن القول إن الكرة في ملعب أوروبا'.
يذكر أن ألمانيا وفرنسا وبريطانيا أطلقت في نهاية يناير الماضي آلية 'إينستكس' لتسهيل الحركة المالية والتجارية مع إيران. وتتخوف الإدارة الأمريكية من تأثير هذه الآلية سلبا على العقوبات المفروضة على طهران، والتي تسعى من خلال الضغط على إيران وإجبارها على إعادة التفاوض حول برنامجها النووي.
thawra
http://www.tehrantelegram.com/story-z23411430
Iran has offered solutions to activate the mechanism of dealing with Europe, which aims to save the nuclear deal by allowing Tehran to continue to deal with European companies despite US sanctions. The easiest way to activate the European mechanisms 'Instex' and the Iranian 'Satma', a counterpart company of the European Mechanism, is the European companies to import oil from Iran or to give a line of credit to European exporters to start exporting to Iran.
He criticized the Iranian official through a post on the 'instagram' published on Monday evening, the failure of the European side to activate the trade mechanism, which was submitted three months ago by the signatories to the nuclear agreement, France, Britain and Germany. Hamati said that 'the Europeans' talk about their efforts to activate the mechanism has become a repetitive and obsolete', saying that the solution presented by is the best way to activate this mechanism.
"If Europeans are concerned about the US reaction to goods exported to Iran, they can test their ability to export commodities and medicines. Now it can be said that the ball is in the stadium of Europe '.
At the end of January, Germany, France and Britain launched the 'Instex' mechanism to facilitate financial and trade movement with Iran. The administration fears the impact of this mechanism negatively on the sanctions imposed on Tehran, which seeks through pressure on Iran and forced to renegotiate its nuclear progra
RIYADH/DUBAI (Reuters) - Saudi Arabia said armed drones struck two of its oil pumping stations on Tuesday, two days after the sabotage of oil tankers near the United Arab Emirates, and the U.S. military said it was braced for “possibly imminent threats to U.S. forces in Iraq” from Iran-backed forces.
The attacks took place against a backdrop of U.S.-Iranian tension following Washington’s decision this month to try to cut Iran’s oil exports to zero and to beef up its military presence in the Gulf in response to what it said were Iranian threats.
Tuesday’s attacks on the pumping stations more than 200 miles (320 km) west of Riyadh and Sunday’s on four tankers off Fujairah emirate have raised concerns that the United States and Iran might inching toward military conflict.
However, U.S. President Donald Trump denied a New York Times report that U.S. officials were discussing a military plan to send up to 120,000 troops to the Middle East to counter any attack or nuclear weapons acceleration by Iran.
“It’s fake news, OK? Now, would I do that? Absolutely. But we have not planned for that. Hopefully we’re not going to have to plan for that. And if we did that, we’d send a hell of a lot more troops than that,” Trump told reporters.
See more stories
Iran’s Supreme Leader Ayatollah Ali Khamenei said there would not be war with the United States despite mounting tensions over Iranian nuclear capabilities, its missile program and its support for proxies in Yemen, Iraq, Syria and Lebanon.
“There won’t be any war. The Iranian nation has chosen the path of resistance,” he said in comments carried by Iran’s state TV. He repeated that Tehran would not negotiate with Washington over Iran’s 2015 nuclear deal with major powers.
The U.S. military cited possible imminent threats to its troops in Iraq and said they were now on high alert. The U.S. was responding to comments from a British deputy commander of the U.S.-led coalition fighting Islamic State remnants in Iraq and Syria who said there had been no increase in the threat from Iran-backed militia.
The comments “run counter to the identified credible threats available to intelligence from U.S. and allies regarding Iranian backed forces in the region,” said Navy Captain Bill Urban, a spokesman at the U.S. military’s Central Command.
Trump withdrew the United States from the Iran nuclear deal a year ago and has sharply increased economic sanctions on Iran.
Under the accord negotiated by Trump’s predecessor Barack Obama, Iran agreed to curb its uranium enrichment capacity, a potential pathway to a nuclear bomb, in return for sanctions relief.
Mexico signed a decree granting Pemex additional fiscal relief to boost oil output from mature fields, which are currently unprofitable under existing terms, the country's finance secretary said Monday.
Pemex will be able to extract up to an additional 400,000 b/d from these areas as a result of this new decree, Carlos Urzua said at a webcast event, in which the state-owned company closed a finance deal with a group of lenders.
The agreement with J.P. Morgan, HSBC, and Mizuho Securities will extend an existing $5.5 billion credit line to Pemex for an additional two years, and refinance $2.5 billion in debt. Under the deal, Pemex will pay an interest rate of 4.85%, much lower than the company's current international financing rates, the CEO of J.P. Morgan Mexico, Felipe Garcia Moreno, said at the event.
The tax relief will be enforced via the migration of certain mature fields from legacy assignment titles into production sharing contracts introduced by Mexico's 2014 energy reform, Urzua said.
Urzua did not say what areas will be migrated. However, he said these are mature fields, which are marginally operating as they are not profitable due to Pemex's current production sharing duties under legacy assignment titles, which cap capital deductions to 12.5% compared with 60% under E&P contracts.
"This will give Pemex a huge relief, allowing to restart some areas that weren't profitable under the old regime," he said.
This new decree will allow Pemex to credit $1.5 billion in 2019 alone, allowing it to boost its upstream investment, the company said in a statement Monday.
'MILKED THIS LITTLE COW'
Pemex's cash flow before taxes is reasonable compared with international peers, Urzua said. According to financial reports, Pemex had pre-tax income of $15.3 billion in 2018.
However, the company's production sharing duties with the federal government were $22.9 billion, resulting in a net loss of $7.5 billion for 2018.
"What is the problem? The problem is that for too long we have milked this little cow to avoid rising any other taxes or fighting fiscal evasion," Urzua said.
Pemex had a fiscal balance of $686 million in April, compared with a net loss of $3.2 billion in January, which it incurred as a result of tax payments, the CEO of Pemex, Octavio Romero Oropeza, said at the event.
Romero said that Pemex's debt is manageable, even though at $106 billion it is the largest for any oil company in the world. Pemex's debt in 2014 was $43 billion.
To offset Mexico's revenue loss from the fiscal relief, Mexico's government has grown tax collection rates by 5%, and expects to raise an additional $5.2 billion in 2019, said Mexican President Andres Manuel Lopez Obrador at the event .
According to the Organization of Economic Cooperation and Development (OECD), Mexico's tax collection as a share of its GDP is 17.4%, nearly half the rate of Brazil or Argentina.
The American Petroleum Institute reported late Tuesday that U.S. crude supplies rose by 8.6 million barrels for the week ended May 10, according to sources. The API also reportedly showed a stockpile increases of 567,000 barrels in gasoline and 2.2 million barrels in distillates.
Price Futures Group expected the API data to show a decline of 3 million barrels in crude supplies, according to analyst Daniel Flynn. It had also forecast stockpiles decreases of 2 million barrels each for gasoline and distillates.
Inventory data from the Energy Information Administration will be released Wednesday.
While the ongoing struggle for control over the Venezuelan state between embattled President Nicolas Maduro and National Assembly leader and interim President Juan Guaidó has captured the world’s attention in recent weeks, a more discreet—but arguably equally important—battle has been playing out in U.S. federal courts that will help determine control over key Venezuelan state assets, such as the U.S. subsidiaries and corporate holdings of state oil behemoth Petróleos de Venezuela, SA (PDVSA).
The Trump Administration’s January 2019 decision to recognize Mr. Guaidó as Venezuela’s lawful president was followed in February by U.S. Treasury Department Office of Foreign Assets Control (OFAC) measures to block PDVSA-related accounts under the Maduro government’s control and redirect those funds to the opposition. On February 13, 2019, the Guaidó-led National Assembly designated a new board of directors for PDVSA-owned U.S. subsidiary CITGO, followed by the designation on February 26, 2019 of attorney general José Ignacio Hernández, with a mandate to protect, control, and recover assets belonging to the republic outside Venezuela.
With billions at stake, one threshold in the opposition’s efforts to legitimize its mandate has been to determine whether U.S. courts will recognize legal counsel retained by Mr. Guaidó to represent the republic’s interests in ongoing disputes and litigation in the United States. Two cases currently working their way through U.S. federal courts may be good harbingers of who will control Venezuela’s state-owned assets (and liabilities) moving forward.
The first, Rusoro Mining Limited, Gold Fields Limited v. Bolivarian Republic of Venezuela is being heard by the U.S. Court of Appeals for the District of Columbia and involves a $1.2 billion arbitration award issued in 2016. The case stems from Venezuela’s failure to compensate Canadian gold-mining firm Rusoro for seizing its assets without compensation in a 2011 drive to nationalize extractive industries. In a May 1, 2019 ruling on a motion filed by attorneys representing the Maduro government that alleged that legal counsel to Mr. Guaidó have no standing to litigate the case, the court denied the Maduro motion, and argued that the executive branch’s “action in recognizing a foreign government…is conclusive on all domestic courts, which are bound to accept that determination.” The judges’ ruling further stated that, “it has long been established that only governments recognized by the United States...are entitled to access to our courts…“).
In a separate similar case, third circuit U.S. court of appeals judge Thomas Ambro ruled on March 20 that Mr. Guaidó’s representatives have standing to present arguments in a legal dispute with Canadian mining firm Crystallex International Corp stemming from the 2011 nationalization of Las Cristinas, a Crystallex-controlled mining project. In his ruling, judge Ambro wrote, “We grant the Republic of Venezuela’s motion to intervene,” in its request for a 120-day stay to allow the national assembly’s counsel “sufficient time to evaluate its position in this and other cases.”
Saudi Aramco restarted pumping oil on Wednesday through the pipeline which was hit by drone attacks on Tuesday, Arab media report.
Two pumping stations along Aramco’s East-West oil pipeline in Saudi Arabia were attacked by explosive-laden drones in the early morning local time on Tuesday, the official Saudi Press Agency (SPA) reported yesterday, citing Saudi Energy Minister Khalid al-Falih, who described the attack as one of “terrorism and sabotage.”
The drones laden with explosives targeted the pump stations on the pipeline which carries oil from eastern Saudi Arabia to the Yanbu port.
Saudi Aramco issued a statement on Tuesday, saying that the sabotage caused minor damage and a fire at one of the pumping stations. Aramco temporarily shut down the pipeline yesterday as a precautionary measure and noted that no injuries or fatalities were reported. The company’s oil and gas supplies haven’t been impacted as a result of the incident either, it said.
“Mr. Al-Falih confirmed that the Kingdom of Saudi Arabia condemns this cowardly attack, emphasizing that this act of terrorism and sabotage in addition to recent acts in the Arabian Gulf do not only target the Kingdom but also the security of world oil supplies and the global economy. These attacks prove again that it is important for us to face terrorist entities, including the Houthi militias in Yemen that are backed by Iran,” the official Saudi agency said on Tuesday.
Related: The Battle For Control Over Iraq’s Oil
This statement came out hours after Houthi-owned TV Almasirah reported that “7 Drones have targeted vital Saudi facilities.”
Reports of the drone attack on Saudi Aramco’s oil infrastructure came a day after Saudi Arabia said that two of its oil tankers were attacked by saboteurs near the United Arab Emirates (UAE), while the UAE said that a total four vessels were attacked off its coast at the port of Fujairah.
The heightened security concerns and the potential threat to global oil supplies in the Middle East lifted oil prices on Monday and early Tuesday, outweighing concerns about an escalating U.S.-China trade war and slowing global economic growth. A large crude build reported by API later on Tuesday, however, weighed down on oil prices, which were still down just before the EIA’s inventory report release on Wednesday.
By Tsvetana Paraskova for Oilprice.com
More Top Reads From Oilprice.com:
Performance Levels
Looking performance record on shares of SandRidge Energy (SD) we observed that the stock has seen a move -36.78% over the last 52-week trading period. The stock generated performance of 9.69% tracking last 3 months and -16.76% over the recent 6 months. Investors will be anxiously watching to see if things will turn around and the stock will start gaining or losing momentum over the next few months. If we look back year-to-date, the stock has performed 17.48%. Shares are at 7.45% over the previous week and 6.56% over the past month.
Investors tracking shares of SandRidge Energy (SD) may be focusing on where the stock is trading relative to its 52-week high and low. At the time of writing, the stock had recently reached at $8.94. At this price, shares can be seen trading -51.07% off of the 52-week high mark and 28.14% away from the 52-week low. Investors often pay increased attention to a stock when it is nearing either mark. The Price Range 52 Weeks is one of the tools that investors use to determine the lowest and highest price at which a stock has traded in the previous 52 weeks. It has a market cap of $315.78M.
Volume Evaluation
Active moving action has been spotted in SandRidge Energy (SD) on Tuesday as stock is moving on change of 6.18% from the open. The US listed company saw a recent price trade of $8.94 and 732315 shares have traded hands in the session. There are 337.65K shares which are traded as an average over the last three months period.
Trading volume can help an investor identify momentum in a stock and confirm a trend. If trading volume increases, prices generally move in the same direction. That is, if a security is continuing higher in an uptrend, the volume of the security should also increase and vice versa. Trading volume can also signal when an investor should take profits and sell a security due to low activity. If there is no relationship between the trading volume and the price of a security, this signals weakness in the current trend and a possible reversal.
Analyst Views: Fluctuating the focus to what the Wall Street analysts are projecting, we can see that the current consensus target price on shares is $10. Analysts often put in a lot of work to study stocks that they cover.
Volatility Insights
Watching some historical volatility numbers on shares of SandRidge Energy (SD) we can see that the 30 days volatility is presently 3.68%. The 7 days volatility is 4.77%. Following volatility data can help measure how much the stock price has fluctuated over the specified time period. Although past volatility action may help project future stock volatility, it may also be vastly different when taking into account other factors that may be driving price action during the measured time period.
The Average True Range (ATR) value reported at 0.32. The average true range (ATR) is a technical analysis indicator that measures volatility by decomposing the entire range of an asset price for that period. A stock experiencing a high level of volatility has a higher ATR, and a low volatility stock has a lower ATR. The ATR may be used by market technicians to enter and exit trades, and it is a useful tool to add to a trading system. It was created to allow traders to more accurately measure the daily volatility of an asset by using simple calculations. The indicator does not indicate the price direction; rather it is used primarily to measure volatility caused by gaps and limit up or down moves. The ATR is fairly simple to calculate and only needs historical price data.
Technical Considerations
SandRidge Energy (SD) stock positioned -11.71% distance from the 200-day MA and stock price situated 9.71% away from the 50-day MA while located 6.99% off of the 20-day MA. SandRidge Energy (SD) traded moved 0.45% from the 50-day high price and spotted a change of 26.81% from the 50-day low point.
RSI value sited with reading of 64.88. RSI is one of the most popular and widely used technical indicators that provides us with many ways to generate buy and sell signals. The fact that RSI is a bounded oscillator (it takes on values from 0 to 100) allows us to identify overbought and oversold levels quite easily. Wilder considered RSI values over 70 overbought and values below 30 oversold, but these values can be adjusted to suit particular needs and markets. For instance, 80 could be used as overbought line in a strong uptrend and 20 as oversold line in a strong downtrend.
Exports of the Permian Basin’s newest kind of oil are set to jump as production surges, exceeding the appetite of U.S. refiners.
Sales of the new grade, known as West Texas Light, began in September, as explorers sought to separate out increasingly lighter and less sulfurous crude bubbling up from wells in West Texas and New Mexico, so it wouldn’t lessen the quality of U.S. benchmark West Texas Intermediate. WTL supply has grown to over 500,000 barrels a day, a nearly four-fold rise from last year.
While some of that is staying close by, most will need to be exported. Even as ample shale barrels and tighter supplies of heavier crudes have encouraged U.S. refiners to process the lightest oil since 1990, that may reach a limit soon. But since many of the biggest refineries have invested billions of dollars in upgrades over the years and are set up to run the heaviest, dirtiest oil, there’s only a certain amount of light oil they can handle.
“I suspect that refineries that can blend to run lighter slates are likely already doing so to the best they can,” said Michael Tran, a commodity strategist at RBC Capital Markets LLC in New York. “Every incremental barrel produced in the U.S. should be earmarked for export,” unless it’s a heavy crude, Tran said.
Shipments overseas began in February and have neared 1.42 million barrels through this month. Most was sent to the Netherlands and the rest for Canada, while none has headed to Asia so far, according to U.S. Customs data and ship tracking data compiled by Bloomberg.
Renewed U.S.-led sanctions on Iran could provide an opportunity. Buyers of Iranian condensates such as South Korea, might consider WTL, Jonathan Aronson, analyst for Cornerstone Marcro LLC in New York.
Presently, some 1 million barrels of storage has been set aside in the Permian and Cushing, Oklahoma, to market WTL, according to people familiar with the matter. Some pipes are starting to accept it as a proper grade, the people said.
More Pipelines
Still, more pipeline capacity would be needed, which is expected to start coming online late this year and in 2020. “Pipelines from Midland and Cushing to the Gulf Coast are full right now. It’s a problem for any crude, including WTL,” Aronson said.
WTL is being marketed to Asian buyers for refining and petrochemical use, according to a report by analysts at Macquarie Capital (USA) Inc. Even with its higher content of light products such as naphtha, it would be globally marketable for at least three years. However, that could change later on because of rapidly growing natural gas liquids and condensates supply, both of which have similar yields.
That might be a boon for buyers, as WTL prices could drop, particularly in Asia, which has numerous other options for light, low-sulfur crudes. Currently, the grade is trading at $1 to $1.50 a barrel under WTI Midland, compared with a $2.50 discount last month, according to people familiar with the matter.
On the whole, WTL would be a great crude for a simple refinery to run and chemical plants would like it, whether in Asia or Europe, Cornerstone’s Aronson said.
https://www.oilandgas360.com/surge-of-new-permian-basin-oil-to-feed-global-supply/
The bills are due for millions of barrels of contaminated Russian oil that have been stuck for weeks in pipelines from Belarus to Germany - but no one wants to pay.
Western oil companies and European refiners that bought the oil a month ago, before discovering it was unusable, have so far refrained from freezing payments as they are keen to maintain good long-term relations with the world’s second biggest oil exporter and avoid protracted legal battles in Russian courts.
Instead, several Western buyers have asked Russian producers if they can postpone payments for the tainted crude while buyers and sellers agree how to resolve the mess - and how to share the costs, four traders involved in Russian oil trading said.
For the buyers of an estimated 19 million barrels of contaminated crude stuck in the pipeline and loaded on tankers, it’s a $1.2 billion question.
The buyers want Russian producers to give guarantees in the form of bank deposits that they will contribute to the clean-up, or delay payments due this week until the crisis is resolved, said a source at European refiner, who declined to be named.
“There’s around 0.8-0.9 million tonnes of dirty oil sitting in the pipelines between Belarus and Germany that no refiner wants to take,” he said. “This oil needs to be evacuated somewhere to restart the pipeline. But it would be wrong for Russia to assume European refiners will bear all costs.”
The refiner said Russian oil producers had yet to respond to the proposals made by major European buyers.
“We are ready to help sort out the problem and find solutions for the dirty oil. But we want Russian producers to come up with financial guarantees that they will help cover the costs,” said a second buyer of Russian oil in Europe.
Russian state-owned oil producer Rosneft said it was too early to comment on the issue. Lukoil declined to comment and Surgutneftegas said it was holding normal commercial talks with its buyers.
International oil companies and trading houses have not commented publicly on the contamination crisis.
State Russian pipeline monopoly Transneft declined to comment on the issue of compensation. It said on Tuesday it was not to blame for the organic chloride contamination because it could only have been added by producers.
MAY DEADLINES
It has been three weeks since Belarus told oil refiners and pipeline operators in Europe that the crude heading towards them down the 5,500 km (3,400 mile) Druzhba pipeline network was heavily contaminated with organic chloride.
Russian oil flows via Druzhba were halted, sending crude to a six-month high above $75 a barrel and tarnishing Russia’s reputation as an exporter at a time of rising competition with U.S. and Middle Eastern oil sales.
Russia has since said the oil was contaminated deliberately by an unnamed local producer while Belarus said it would take months to restore clean oil supplies to Europe via Druzhba.
Organic chloride is used to clean oil wells and accelerate the flow of crude but it should be removed before the oil enters the supply chain as the compounds can damage refining equipment.
To get the pipeline working again, the tainted oil needs to be removed and stored somewhere so it can be diluted with clean oil - in some cases in proportions of one to 30 - to bring the organic chloride down to safe levels.
Traders estimate the process for all the contaminated oil in Druzhba would cost tens of millions of dollars.
In the meantime, the question of who should pay for the contaminated oil when the bills come due this week remains.
$1.2 BILLION QUESTION
Exports to Europe via Druzhba are fairly complicated because they involve dozens of sellers, buyers and banks. Normally, contracts are rolled over and letters of credit renewed as payments are made via intermediaries - and the oil keeps flowing.
But the contamination has thrown a spanner in the works.
Russian producers sell oil to European refiners along the Druzhba pipeline in Germany, Poland, Slovakia, Hungary and the Czech Republic. Those refineries are owned by companies such as PKN Orlen, Grupa Lotos, MOL, Total, Eni and Shell, among others.
Once the Russian oil producers have transferred their crude to Transneft, it effectively becomes responsible for delivering the right quality of crude to pipeline companies in Europe.
As soon as those companies, such as Poland’s PERN or Slovakia’s Transpetrol, acknowledge receipt of oil from Transneft, the ownership of the crude passes from Russian sellers to European buyers.
But no money changes hands at this point as payment is usually due in the middle of the next month, meaning the bills for oil exported via Druzhba in April should be paid by mid-May.
According to trading sources, at least 19 million barrels of contaminated crude, worth $1.2 billion at current market prices, has yet to be paid for.
That includes 8 million barrels in the Druzhba pipeline and another 11 million barrels loaded onto tankers at Ust-Luga port in the Baltic. Those vessels are now anchored off Europe because the trading houses that took on the oil are struggling to sell it to refiners.
Russian producers, meanwhile, have already paid taxes to the Russian state for the oil they sold in April - such as export duties and mineral extraction taxes - putting them under pressure to recoup money owed by the buyers.
‘EXPENSIVE EXERCISE’
With payment deadlines looming, none of the Western oil buyers has yet instructed their banks to withhold funds as that could have significant repercussions, according to traders.
“You can of course say that I won’t pay because I didn’t get the right quality oil,” said an executive at a major commodities trading house. “But no one wants this nuclear option. We prefer responsible dialogue.”
Another source with a major buyer said the money it owes for Ust-Luga cargoes will be paid on time but it will be accompanied by claims for damages against the sellers for poor quality.
Further complicating talks between buyers and sellers is the fact that the various oil contracts in question fall under different legal systems.
Most sales along the pipeline are governed by Russian law - which leaves issues of oil quality open to interpretation. Sales from Ust-Luga, meanwhile, are mostly governed by English law, according to traders familiar with the contracts.
“We expect a complicated claim handling through the whole supply chain of Russian crude oil,” said Swedish refiner Preem.
Belarusian refiner Naftan said it had filed claims against unnamed Russian suppliers for delivering low quality oil during April.
For now though, until buyers and sellers can agree how to get the tainted oil out of Druzhba - and who will foot the bill - the pipeline is set to remain shut.
“Based on Druzhba’s normal throughput, every new day of stoppage costs Russia $80 million in lost revenue. That is an expensive exercise,” said the trader with a European refiner.
U.S. crude oil refinery inputs averaged 16.7 million barrels per day during the week ending May 10, 2019, which was 271,000 barrels per day more than the previous week’s average. Refineries operated at 90.5% of their operable capacity last week. Gasoline production decreased last week, averaging 9.9 million barrels per day. Distillate fuel production increased last week, averaging 5.3 million barrels per day.
U.S. crude oil imports averaged 7.6 million barrels per day last week, up by 919,000 barrels per day from the previous week. Over the past four weeks, crude oil imports averaged about 7.2 million barrels per day, 9.6% less than the same four-week period last year. Total motor gasoline imports (including both finished gasoline and gasoline blending components) last week averaged 752,000 barrels per day, and distillate fuel imports averaged 41,000 barrels per day.
U.S. commercial crude oil inventories (excluding those in the Strategic Petroleum Reserve) increased by 5.4 million barrels from the previous week. At 472.0 million barrels, U.S. crude oil inventories are about 2% above the five year average for this time of year. Total motor gasoline inventories decreased by 1.1 million barrels last week and are about 2% below the five year average for this time of year. Finished gasoline inventories increased while blending components inventories decreased last week. Distillate fuel inventories increased by 0.1 million barrels last week and are about 4% below the five year average for this time of year. Propane/propylene inventories increased by 2.8 million barrels last week and are about 19% above the five year average for this time of year. Total commercial petroleum inventories increased last week by 14.6 million barrels last week.
Total products supplied over the last four-week period averaged 20.1 million barrels per day, up by 0.3% from the same period last year. Over the past four weeks, motor gasoline product supplied averaged 9.4 million barrels per day, up by 0.5% from the same period last year. Distillate fuel product supplied averaged 4.0 million barrels per day over the past four weeks, down by 4.5% from the same period last year. Jet fuel product supplied was up 11.0% compared with the same four-week period last year.
Domestic production down 100,000 bbls day
Exports up 1,025,000 bbls day
Cushing up 1.8 mln bbls
https://www.ft.com/content/d3d63bba-7653-11e9-be7d-6d846537acab
7 HOURS AGO When Vicki Hollub stood up to speak at Occidental Petroleum’s annual meeting last Friday, she knew she was facing a sceptical audience. After three years as chief executive, she had just agreed the most ambitious move of her career, the $56bn acquisition of rival Anadarko Petroleum, and many investors feared she was overreaching. Buying Anadarko, one of the largest US independent oil and gas groups, with assets around the world from Texas to Mozambique, will double the size of Occidental. It will also saddle the company with debts of around $50bn, in return for a business that has been failing to cover its capital spending from its operating cash flows. Ms Hollub promised billions of dollars worth of cost savings and productivity gains from the deal, but many investors remain sceptical that she can deliver. “It is simply outrageous,” said one top 10 shareholder before the meeting. The deal poses several operational risks as well as putting enormous pressure on Occidental’s balance sheet, he warned. Investors’ lack of enthusiasm for the deal was reflected in Occidental’s share price, which dropped to a 10-year low as Anadarko accepted its offer.
 Michael FitzsimmonsRenewable energy, oil & gas, dividend investing, gold
Summary
OXY's stock has been on a downward trend ever since it started bidding for Anadarko and is now trading at 12-year lows.
The company significantly overpaid for Anadarko's resource base, very similar to Exxon's deal for XTO.
Making matters worse was the "Buffett deal": great for Berkshire, but awful for OXY shareholders.
Meantime, Chevron walks away a stronger company with its financial discipline firmly intact (and a $1 billion break-up fee that will be used to buy back shares).
 Occidental Petroleum's (OXY) stock has been heading lower ever since it started bidding for Anadarko Petroleum (APC). It's now trading at the same level it was back in May of 2007. Interestingly enough, so is Exxon Mobil(XOM). And for the same reason: overpaying for resources in an age of energy abundance (in Exxon's case, it was a $40 billion deal to buy XTO).
OXY should have realized that in an age of "no moat" energy investing (see my article Energy Companies' Big Problem? There's No Moat), it is a huge mistake to overpay for resources. As I pointed out in my "no moat" piece - instead of a handful of big companies dominating domestic energy production prior to the shale renaissance, there are now dozens and dozens of domestic E&P companies that are producing significant volumes of oil and gas.
 Source: Yahoo Finance
The result, of course, is lower prices. NYMEX gas is currently trading around $2.60 and the CME futures strip show it will trade under $3 as far as the eye can see. Associated gas in the Permian Basin is so high, and pipeline exit capacity so constrained, that ConocoPhillips (COP) reported on its Q1 conference call that WAHA gas went severely negative during the quarter:
We're generally, I'd say in the first quarter of most of our gas was sold into Arizona and California market. So we didn't see why I type pricing. On the other hand – other side of that on the gas marketing side, we did benefit a good bit from Waha pricing as we were in the market some days with producers paying us, as much as $6 or $7 Mcf.
That is, Permian producers were paying COP $6-7/Mcf to take their gas production and ship it out of the region. Note that Conoco - which has a large gas marketing business and sells much of its regional gas production into Arizona and California - is not much exposed to WAHA pricing. That is one reason COP's average realized price for Q1 ($50.59/boe) was so much higher as compared to companies like EOG Resources (EOG) ($39.56/boe) and Pioneer Natural Resources (PXD) ($37.84/boe). The other, of course, is that COP's production profile is 75% levered to Brent instead of WTI.
Going forward, things aren't a whole lot better on the oil front. Domestic E&P companies are fully aware the oil price recovery they are currently enjoying is because both Saudi Arabia and Russia decided to cut back production in order to get the price up and to allow U.S. exports to elbow their way into the global oil market.
But even that may not work much longer because in the 2H of this year multiple Permian-to-Gulf Coast oil pipelines will go in-service - including Phillips 66's (PSX) 900,000 bpd Gray Oak pipeline - that will greatly enhance pipeline exit capacity out of the play. This is happening just as two heavyweights - Chevron (CVX) and Exxon - are now in "manufacturing mode" in the Permian and will be significantly ramping up production. Will Russia and Saudi Arabia continue to allow the US to pick up more global market share? Again, there is an abundance of supply.
So as we have seen over the past few years, the price of natural gas has been decimated and the price of oil is dependent on the actions of other nation states to cut production. This is exactly what you would expect in an age of energy abundance and the "no moat" energy sector that enables any company with easy access to money and shale drilling technology can punch a hole, drill a well, and produce hydrocarbons.
The worst mistake a company can make in this environment is to overpay for resources. And OXY had a perfect example to learn from the Exxon deal for XTO. After years of spending tens of billion dollars on share buybacks, most of those shares were reissued in Exxon's $40 billion deal to buy XTO. And then the bottom dropped out of the price of gas. The XTO assets were not even able to pay the dividend obligation on the re-issued XOM shares. As a result, Exxon's stock today trades below where it was 10 years ago.
Similarly, OXY's stock is now trading below where it was 12 years ago. Why do I say OXY overpaid? Rather than go into an in-depth analysis of APC's reserves report (which many might argue is absolutely necessary), just consider that APC came to an agreement to sell out to Chevron for $33 billion. Now one would assume that Anadarko's CEO and Board of Directors did do an in-depth analysis of the reserves report. Some may disagree considering Anadarko's BOD decided to greatly increase the CEO's compensation should a buyout happen, and they may have a good point. But that's a separate issue and, still, the agreed upon price was $33 billion.
Then OXY comes along and bids ~$38 billion for Anadarko (~15% more than Chevron). If you tack on the $1 billion break-up fee that APC has to pay Chevron (and that OXY can't keep...), the bid was ~18% higher than Chevron's.
Even worse, OXY - in a hurry to get financing in place - made a $10 billion dealwhereby Buffett's Berkshire Hathaway (NYSE:BRK.A) (NYSE:BRK.B) will:
So not only did OXY pay significantly more than Chevron was willing to pay (and that APC was willing to take), they took on some very expensive debt AND created what is in effect a new and separate class of stock just for Berkshire Hathaway. Wow.
Now, some analysts made a big deal out of the fact that OXY was able to make an $8.8 billion deal to sell APC's African assets to Total (TOT). That will certainly help OXY's balance sheet. However, consider that Chevron has much more experience in building and operating LNG assets than either OXY or APC and likely had a very good idea of what APC's African assets were worth - whether by monetizing the asset by selling it, or, by participating in the LNG project itself.
As a result of the big Anadarko deal, OXY's stock is weakening and Chevron's stock strengthening. Those who say Chevron "lost" in the deal obviously don't understand that Chevron - with a market cap of $232 billion, more than 5x that of OXY - could have easily "won" the bidding war for APC had it chose to do so. But, as Chevron CEO Michael Wirth said in the "bowing out" press release:
Winning in any environment doesn’t mean winning at any cost. Cost and capital discipline always matter, and we will not dilute our returns or erode value for our shareholders for the sake of doing a deal.
This quote echoed comments that ConocoPhillips CEO Ryan Lance made at this week's Annual Meeting regarding Permian M&A:
The big corporate M&A that requires these very large premiums that we've seen here in the last month or so, those are very tough. Those are hard to do. Those are destructive to value. They're destructive to returns.
It's no coincidence that I own both Chevron and Conoco. Both are FCF-generating machines with WTI over $60. Both have excellent management teams that are pragmatic about the new age of energy abundance and are showing excellent capital discipline. And both will likely significantly outperform those companies that are not pragmatic about the age of energy abundance and are not disciplined (Exxon and OXY, just to name two).
Chevron is a BUY and I reiterate my $135 price target based on expectations for high quality earnings and massive FCF generation (not to mention the extra $1 billion in share buybacks due to the break-up fee). See my late 2018 Seeking Alpha article Chevron: A FCF Generating Machine In High Gear. Chevron's 4% dividend yield is very attractive considering the recent US/China trade "squabble" has the 10-year Treasury back under 2.5%.
Note that Chevron is now a "conviction buy" at Goldman Sachs with a $144 price target.
TEHRAN, May 13 (MNA) – Oil futures rose on Monday on increasing concerns about supply disruptions in the crucial producing region of the Middle East after two oil tankers were attacked in the Sea of Oman.
Brent crude futures reached $71.71 a barrel at noon, up $1.09, Reuter reported.
US West Texas Intermediate (WTI) futures were at $62.45 per barrel, up 79 cents.
The United Arab Emirates said on Sunday that four commercial vessels were attacked near Fujairah, one of the world’s largest bunkering hubs. The port lies near the Strait of Hormuz, one of the world’s most important oil export waterways.
Saudi Arabia said on Monday that two Saudi oil tankers were among vessels targeted by the attack off the coast UAE coast.
Several Persian Gulf states have expressed concerns over the attack, condemning it as an attempt to undermine the security of the region. Iran’s Foreign Ministry called the incidents “worrisome and dreadful” and asked for an investigation into the matter.
Saudi Arabia and the UAE are the largest and third-largest producers, respectively, in the Organization of the Petroleum Exporting Countries (OPEC), according to the latest survey by Reuters.
Besides, according to analysts, the rising geopolitical tensions in the Middle East, together with sharply declining oil supplies from Venezuela and Iran due to the US' unilateral sanctions, will remain bullish for prices.
Investors are now focused on tightened supplies following OPEC-led production cuts since the start of the year.
Mehrnews
Last Updated: July 25, 2017 (Notes)
full report
Overview
World chokepoints for maritime transit of oil are a critical part of global energy security. About 61% of the world's petroleum and other liquids production moved on maritime routes in 2015. The Strait of Hormuz and the Strait of Malacca are the world's most important strategic chokepoints by volume of oil transit.
The U.S. Energy Information Administration (EIA) defines world oil chokepoints as narrow channels along widely used global sea routes, some so narrow that restrictions are placed on the size of the vessel that can navigate through them. Chokepoints are a critical part of global energy security because of the high volume of petroleum and other liquids transported through their narrow straits. In 2015, total world petroleum and other liquids supply was about 96.7 million barrels per day (b/d).1 EIA estimates that about 61% that amount (58.9 million b/d) traveled via seaborne trade.2 Oil tankers accounted for almost 28% of the world’s shipping by deadweight tonnage in 2016, according to data from the United Nations Conference on Trade and Development (UNCTAD), having fallen steadily from 50% in 1980.3 International energy markets depend on reliable transport routes. Blocking a chokepoint, even temporarily, can lead to substantial increases in total energy costs and world energy prices. Chokepoints also leave oil tankers vulnerable to theft from pirates, terrorist attacks, political unrest in the form of wars or hostilities, and shipping accidents that can lead to disastrous oil spills. The seven chokepoints highlighted in this report are part of major trade routes for global seaborne oil transportation. Disruptions to these routes could affect oil prices and add thousands of miles of transit in alternative routes. By volume of oil transit, the Strait of Hormuz, leading out of the Persian Gulf, and the Strait of Malacca (linking the Indian and Pacific Oceans) are the world's most important strategic chokepoints. This report also discusses the role of the Cape of Good Hope, which is not a chokepoint but is a major trade route and potential alternate route to certain chokepoints.
Figure 1. Daily transit volumes through world maritime oil chokepoints All estimates in million barrels per day. Includes crude oil and petroleum liquids. Based on 2016 data.
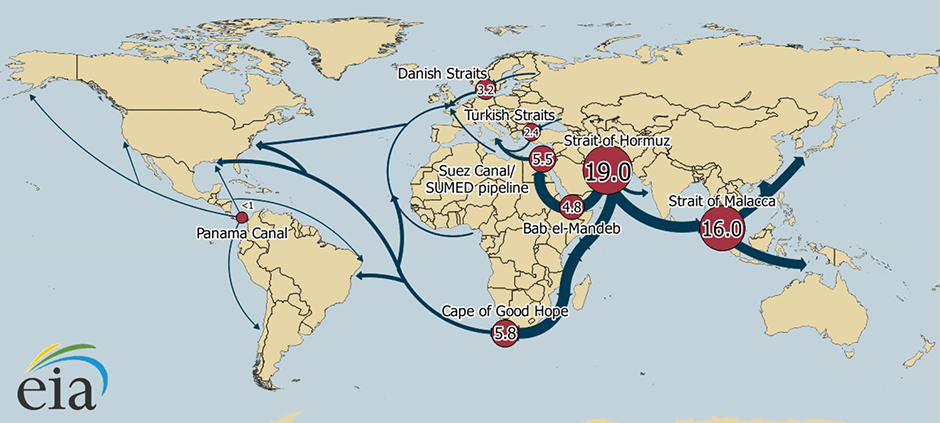
Source: U.S. Energy Information Administration
Table 1. Volume of crude oil and petroleum products transported through world chokepoints and the Cape of Good Hope, 2011-16 (million b/d) Location 2011 2012 2013 2014 2015 2016 Strait of Hormuz 17.0 16.8 16.6 16.9 17.0 18.5 Strait of Malacca 14.5 15.1 15.4 15.5 15.5 16.0 Suez Canal and SUMED Pipeline 3.8 4.5 4.6 5.2 5.4 5.5 Bab el-Mandab 3.3 3.6 3.8 4.3 4.7 4.8 Danish Straits 3.0 3.3 3.1 3.0 3.2 3.2 Turkish Straits 2.9 2.7 2.6 2.6 2.4 2.4 Panama Canal 0.8 0.8 0.8 0.9 1.0 0.9 Cape of Good Hope 4.7 5.4 5.1 4.9 5.1 5.8 World maritime oil trade 55.5 56.4 56.5 56.4 58.9 n/a World total petroleum and other liquids supply 88.8 90.8 91.3 93.8 96.7 97.2 Note: Data for Panama Canal are by fiscal year.
Sources: U.S. Energy Information Administration analysis based on Lloyd's List Intelligence, Panama Canal Authority, Argus FSU, Suez Canal Authority, GTT, BP Statistical Review of World Energy, IHS Waterborne, Oil and Gas Journal, and UNCTAD, using EIA conversion factors.4
Oil tanker sizes
Ships carrying crude oil and petroleum products are limited by size restrictions imposed by maritime oil chokepoints. The global crude oil and refined product tanker fleet uses a classification system to standardize contract terms, to establish shipping costs, and to classify vessels for chartering contracts. This system, known as the Average Freight Rate Assessment (AFRA) system, was established by Royal Dutch Shell six decades ago, and the London Tanker Brokers' Panel (LTBP), an independent group of shipping brokers, oversees the system. AFRA uses a scale that classifies tanker vessels according to deadweight tons—a measure of a ship's capacity to carry cargo. The approximate capacity of a ship in barrels is determined using an estimated 90% of a ship's deadweight tonnage, which is multiplied by a barrel-per-metric-ton conversion factor specific to each type of petroleum product and crude oil, as liquid fuel densities vary by type and grade. The smaller vessels on the AFRA scale—the General Purpose (GP) and Medium Range (MR) tankers—are commonly used to transport cargos of refined petroleum products over relatively shorter distances, such as from Europe to the U.S. East Coast. Their smaller size allows them to access most ports around the globe. A GP tanker can carry between 70,000 barrels and 190,000 barrels of motor gasoline (3.2-8 million gallons), and an MR tanker can carry between 190,000 barrels and 345,000 barrels of motor gasoline (8-14.5 million gallons). Long Range (LR) class ships are the most common ships in the global tanker fleet, as they are used to carry both refined products and crude oil. These ships can access most large ports that ship crude oil and petroleum products. An LR1 tanker can carry between 345,000 barrels and 615,000 barrels of gasoline (14.5-25.8 million gallons) or between 310,000 barrels and 550,000 barrels of light sweet crude oil. A large portion of the global tanker fleet is classified as AFRAMAX. AFRAMAX vessels are ships between 80,000 deadweight tons and 120,000 deadweight tons. This ship size is popular with oil companies for logistical purposes, and many ships have been built within these specifications. Because the AFRAMAX range exists somewhere between the LR1 and LR2 AFRA scales, the LTBP does not publish a freight assessment specifically for AFRAMAX vessels. Over the history of AFRA, vessels grew in size, and newer classifications were added. The Very Large Crude Carrier (VLCC) and Ultra-Large Crude Carrier (ULCC) were added as the global oil trade expanded and larger vessels provided better economics for crude oil shipments. VLCCs are responsible for most crude oil shipments around the globe, including in the North Sea, home of the crude oil price benchmark Brent. A VLCC can carry between 1.9 million and 2.2 million barrels of a West Texas Intermediate (WTI) type crude oil.
Figure 2. Average Freight Rate Assessment (AFRA) Scale-Fixed Source: U.S. Energy Information Administration, London Tanker Brokers' Panel5
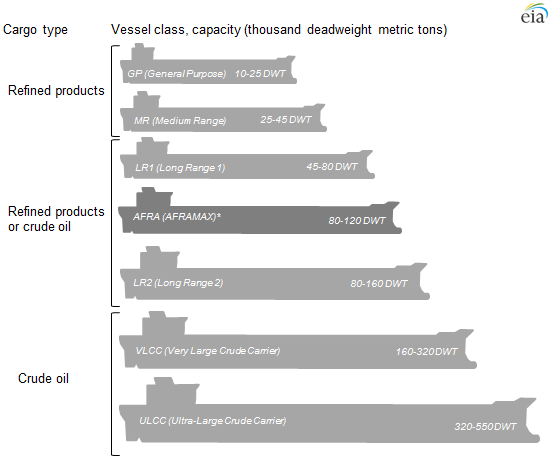
Note: AFRAMAX is not an official vessel classification on the AFRA scale but is shown here for comparison.
Strait of Hormuz
The Strait of Hormuz is the world's most important chokepoint, with an oil flow of 17 million b/d in 2015, about 30% of all seaborne-traded crude oil and other liquids during the year. In 2016, total flows through the Strait of Hormuz increased to a record high of 18.5 million b/d.
Located between Oman and Iran, the Strait of Hormuz connects the Persian Gulf with the Gulf of Oman and the Arabian Sea. The Strait of Hormuz is the world's most important oil chokepoint because its daily oil flow of about 17 million barrels per day in 2015, accounted for 30% of all seaborne-traded crude oil and other liquids. The volume that traveled through this vital choke point increased to 18.5 million b/d in 2016. EIA estimates that about 80% of the crude oil that moved through this chokepoint went to Asian markets, based on data from Lloyd’s List Intelligence tanker tracking service.6 China, Japan, India, South Korea, and Singapore are the largest destinations for oil moving through the Strait of Hormuz. Qatar exported about 3.7 trillion cubic feet per year of liquefied natural gas (LNG) through the Strait of Hormuz in 2016, according to BP’s Statistical Review of World Energy 2017.7 This volume accounts for more than 30% of global LNG trade. Kuwait imports LNG volumes that travel northward through the Strait of Hormuz. At its narrowest point, the Strait of Hormuz is 21 miles wide, but the width of the shipping lane in either direction is only two miles wide, separated by a two-mile buffer zone. The Strait of Hormuz is deep enough and wide enough to handle the world's largest crude oil tankers, with about two-thirds of oil shipments carried by tankers in excess of 150,000 deadweight tons coming through this Strait.
Pipelines available as bypass options
Most potential options to bypass Hormuz are currently not operational. Only Saudi Arabia and the United Arab Emirates (UAE) have pipelines that can ship crude oil outside of the Persian Gulf and have additional pipeline capacity to circumvent the Strait of Hormuz. At the end of 2016, the total available crude oil throughput pipeline capacity from the two countries combined was estimated at 6.6 million b/d, while the two countries combined had roughly 3.9 million b/d of unused bypass capacity (Table 2). Saudi Arabia has the 746-mile Petroline, also known as the East-West Pipeline, which runs across Saudi Arabia from its Abqaiq complex to the Red Sea. The Petroline system consists of two pipelines with a total nameplate (installed) capacity of about 4.8 million b/d. The 56-inch pipeline has a nameplate capacity of 3 million b/d. The 48-inch pipeline had been previously operating as a natural gas pipeline, but Saudi Arabia converted it to an oil pipeline. The switch increased Saudi Arabia's spare oil pipeline capacity to bypass the Strait of Hormuz from 1 million b/d to 2.8 million b/d, but this volume is only achievable if the system operates at its full nameplate capacity. In 2016, Saudi Aramco announced that it plans to expand the capacity of the East-West pipeline to 7 million b/d, with a scheduled completion by end-2018. To date, there has been little progress on the pipeline expansion. Saudi Arabia also operates the Abqaiq-Yanbu natural gas liquids pipeline, which has a capacity of 290,000 b/d. The UAE operates the Abu Dhabi Crude Oil Pipeline (1.5 million b/d) that runs from Habshan (a collection point for Abu Dhabi's onshore oil fields) to the port of Fujairah on the Gulf of Oman, which allows crude oil shipments to circumvent the Strait of Hormuz. The government plans to increase the capacity of this pipeline to 1.8 million b/d.
Figure 3. Map of the Strait of Hormuz Source: U.S. Department of State
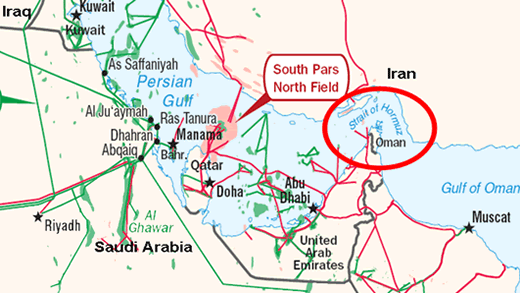
Other pipelines are currently unavailable as bypass options
Saudi Arabia has two additional pipelines that run parallel to the Petroline system and bypass the Strait of Hormuz, but neither of the pipelines has the ability to transport additional volumes of oil if the Strait of Hormuz is closed. The 1.65 million b/d, 48-inch Iraqi Pipeline in Saudi Arabia (IPSA), which runs parallel to the Petroline from pump station #3 (11 pumping stations run along the Petroline) to the port of Mu'ajjiz, just south of Yanbu, Saudi Arabia, was built in 1989 to carry 1.65 million b/d of crude oil from Iraq to the Red Sea. The pipeline closed indefinitely following the August 1990 Iraqi invasion of Kuwait. In June 2001, Saudi Arabia seized ownership of IPSA as compensation for debts Iraq owed and converted it to transport natural gas to power plants. Other pipelines, such as the Trans-Arabian Pipeline (TAPLINE) running from Qaisumah in Saudi Arabia to Sidon in Lebanon or a strategic oil pipeline between Iraq and Turkey, have been out of service for years because of war damage, disuse, or political disagreements. These pipelines would require extensive renovation before they could transport oil. Relatively small quantities, several hundred thousand barrels per day at most, could also be transported by truck if the Strait of Hormuz were closed. Table 2. Operating pipelines that bypass the Strait of Hormuz, 2016 Pipeline name Country Status Capacity Throughput Unused capacity Petroline (East-West Pipeline) Saudi Arabia Operating 4.8 1.9 2.9 Abu Dhabi Crude Oil Pipeline United Arab Emirates Operating 1.5 0.5 1.0 Abqaiq-Yanbu Natural Gas Liquids Pipeline Saudi Arabia Operating 0.3 0.3 0.0 Iraqi Pipeline in Saudi Arabia (IPSA) Saudi Arabia Converted to natural gas 0.0 - 0.0 Total 6.6 2.7 3.9 Note: All estimates expressed in million barrels per day (b/d). Unused capacity is defined as pipeline capacity that is not currently used but can be readily available.
Sources: U.S. Energy Information Administration, Lloyd’s List Intelligence.
Strait of Malacca
The Strait of Malacca, linking the Indian Ocean and the Pacific Ocean, is the shortest sea route between the Middle East and growing Asian markets. Flows through the Strait of Malacca rose to 16 million b/d in 2016, retaining its position as the second busiest transit chokepoint.
The Strait of Malacca, located between Indonesia, Malaysia, and Singapore, links the Indian Ocean to the South China Sea and to the Pacific Ocean. The Strait of Malacca is the shortest sea route between Persian Gulf suppliers and the Asian markets—notably China, Japan, South Korea, and the Pacific Rim. Oil shipments through the Strait of Malacca supply China and Indonesia, two of the world's fastest-growing economies. This Strait is the primary chokepoint in Asia, with an estimated 16.0 million b/d flow in 2016, compared with 14.5 million b/d in 2011. Crude oil generally makes up between 85% and 90% of total oil flows per year, and petroleum products account for the remainder (Table 3). At its narrowest point in the Phillips Channel of the Singapore Strait, the Strait of Malacca is only about 1.7 miles wide, creating a natural bottleneck with the potential for collisions, grounding, or oil spills.8 According to the International Maritime Bureau's Piracy Reporting Centre, piracy, including attempted theft and hijackings, is a threat to tankers in the Strait of Malacca, and ships saw an increasing number of attacks in 2015. Data for 2016 were not available at the time of publication.9 If the Strait of Malacca were blocked, nearly half of the world's fleet would be required to reroute around the Indonesian archipelago, such as through the Lombok Strait between the Indonesian islands of Bali and Lombok, or through the Sunda Strait between Java and Sumatra.10 Rerouting would tie up global shipping capacity, add to shipping costs, and potentially affect energy prices. Several proposals have been made to build bypass options and reduce tanker traffic through the Strait of Malacca. In particular, China and Myanmar (Burma) commissioned the Myanmar-China natural gas pipeline in 2013 that stretches from Myanmar's ports in the Bay of Bengal to the Yunnan province of China. The pipeline has a capacity of 424 billion cubic feet per year. The oil portion of the pipeline was completed in August 2014 and it is now operational at full capacity since the 260,000 b/d refinery in Yunnan, China, began operating in June 2017. The Myanmar-China oil line transports Middle Eastern oil, allowing it to bypass the Strait of Malacca.11 The Strait of Malacca is also an important transit route for liquefied natural gas (LNG) from Persian Gulf and African suppliers, particularly Qatar, to East Asian countries with growing LNG demand. The biggest importers of LNG in the region are Japan and South Korea.
Table 3. Strait of Malacca oil and liquefied natural gas (LNG) flows, 2011-16 million barrels per day 2011 2012 2013 2014 2015 2016 Total oil flows through Strait of Malacca 14.5 15.1 15.4 15.5 15.5 16.0 crude oil 12.8 13.2 13.3 13.3 13.9 14.6 refined products 1.7 1.9 2.1 2.2 1.6 1.4 LNG (Tcf per year) 2.8 3.5 3.9 4.1 3.6 3.2 Notes: Tcf = Trillion cubic feet.
Sources: U.S. Energy Information Administration analysis based on Lloyd’s List Intelligence, IHS Waterborne, BP.12
Figure 4. Map of the Strait of Malacca Source: CIA Factbook
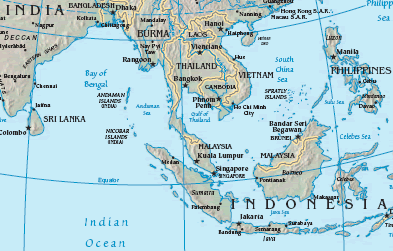
Suez Canal/SUMED Pipeline
The Suez Canal and the SUMED Pipeline are strategic routes for Persian Gulf oil and natural gas shipments to Europe and North America. These two routes combined accounted for about 9% of the world’s seaborne oil trade in 2015.
Suez Canal
The Suez Canal is located in Egypt and connects the Red Sea and the Gulf of Suez with the Mediterranean Sea. In 2016, total petroleum and other liquids (crude oil and refined products) and LNG accounted for 17% and 6% of total Suez cargoes, measured by net metric tonnage, respectively. The Suez Canal cannot handle Ultra Large Crude Carriers (ULCC) and fully laden Very Large Crude Carriers (VLCC) class crude oil tankers. The Suezmax was the largest ship that could navigate through the canal until 2010, when the Suez Canal Authority extended the canal depth to 66 feet to allow more than 60% of all tankers to transit the Canal, according to the Suez Canal Authority. In addition, almost 93% of bulk carriers and 100% of container ships have been able to transit the Suez Canal since 2010.13 In 2016, 3.9 million b/d of total oil (crude oil and refined products) transited the Suez Canal in both directions, according to data published by the Suez Canal Authority. Northbound flows rose by about 300,000 b/d in 2016, but southbound shipments decreased for the first time since at least 2009. Increased crude oil exports from Iraq and Saudi Arabia to Europe contributed to higher northbound traffic, while lower exports of petroleum products from Russia to Asia contributed the most to lower southbound traffic. Most oil transiting the Suez Canal was sent northbound (2.4 million b/d) toward European and North American markets, and the remainder was sent southbound (1.5 million b/d), mainly toward Asian markets. Oil exports from Persian Gulf countries (Saudi Arabia, Iraq, Kuwait, United Arab Emirates, Iran, Oman, Qatar, and Bahrain) accounted for 84% of Suez Canal northbound oil flows. The largest importers of northbound oil flows through the Suez Canal in 2016 were European countries (78%) and the United States (14%). Oil exports from Russia accounted for the largest share of (17%) of Suez southbound oil flows, followed by Turkey (15%) and Netherlands (11%). North Africa (Algeria and Libya) made up 12% of the southbound flow. The largest importers of Suez southbound oil flows were Asian countries, with Singapore, China and India accounting for more than 50% of the total. Total traffic through the Suez Canal has been steadily increasing since 2009, and total oil flows rose to more than 2 million b/d by 2014. The increase in oil shipments during 2015 and 2016 in particular reflect increased OPEC production and exports, including increased output in Iraq and Saudi Arabia, and increased exports from Iran in 2016 as sanctions targeting its oil exports were eased.
SUMED Pipeline
The 200-mile long SUMED Pipeline, or Suez-Mediterranean Pipeline, transports crude oil through Egypt from the Red Sea to the Mediterranean Sea. The crude oil flows through two parallel pipelines that are 42 inches in diameter, which have a total pipeline capacity of 2.34 million b/d. Oil flows north starting at the Ain Sukhna terminal along the Red Sea coast to its end point at the Sidi Kerir terminal on the Mediterranean Sea. SUMED is owned by the Arab Petroleum Pipeline Company, a joint venture between the Egyptian General Petroleum Corporation (50%), Saudi Aramco (15%), Abu Dhabi's International Petroleum Investment Company (15%), multiple Kuwaiti companies (15%), and Qatar Petroleum (5%). 14 The SUMED Pipeline is the only alternate route to transport crude oil from the Red Sea to the Mediterranean Sea if ships cannot navigate through the Suez Canal. Closure of the Suez Canal and the SUMED Pipeline would require oil tankers to divert around the southern tip of Africa, the Cape of Good Hope, which would add approximately 2,700 miles to the transit from Saudi Arabia to the United States. The increased transit time would also increase costs and shipping time, according to the U.S. Department of Transportation.15 According to the International Energy Agency (IEA), shipping around Africa would add 15 days of transit to Europe and 8–10 days to the United States. 16 Fully laden VLCCs going toward the Suez Canal also use the SUMED Pipeline for lightering. Lightering occurs when a vessel needs to reduce its weight and draft by offloading cargo to enter a restrictive waterway, such as a canal. The Suez Canal is not deep enough for a fully-laden VLCC and, therefore, a portion of the crude is offloaded at the SUMED Pipeline at the Ain Sukhna terminal. The now partially-laden VLCC goes through the Suez Canal and picks up the offloaded crude at the other end of the pipeline at the Sidi Kerir terminal. In 2016, 1.6 million b/d of crude oil was transported through the SUMED Pipeline to the Mediterranean Sea, and then loaded onto tankers for seaborne trade. Flows via SUMED were relatively unchanged compared with 2015. Total oil flows via SUMED and the Suez Canal were 5.5 million b/d in 2016, 100,000 b/d more than in 2015. Total oil flows via the Suez Canal and SUMED pipeline accounted for about 9% of total seaborne-traded oil in 2015. Table 4. Suez Canal and SUMED pipeline flows of oil and liquefied natural gas (LNG), 2011-16 million barrels per day 2011 2012 2013 2014 2015 2016 Total oil flows via the Suez Canal and SUMED pipeline 3.8 4.5 4.6 5.2 5.4 5.5 Suez Canal total flows crude oil 0.7 1.4 1.5 1.8 1.6 1.8 refined products 1.4 1.6 1.7 2.0 2.2 2.0 total oil 2.2 2.9 3.2 3.7 3.8 3.9 LNG (Tcf per year) 2.1 1.5 1.2 1.2 1.3 1.2 Suez northbound flows crude oil 0.5 0.9 1.1 1.4 1.2 1.4 refined products 0.9 0.8 0.7 0.8 0.8 1.0 total oil 1.4 1.7 1.9 2.1 2.1 2.4 LNG (Tcf per year) 1.8 1.2 1 0.9 1.1 0.8 Suez southbound flows crude oil 0.2 0.5 0.4 0.4 0.4 0.4 refined products 0.6 0.8 1 1.2 1.4 1.1 total oil 0.8 1.3 1.3 1.6 1.7 1.5 LNG (Tcf per year) 0.2 0.3 0.2 0.3 0.3 0.3 SUMED pipeline crude oil flows 1.7 1.5 1.5 1.5 1.6 1.6 Notes: Totals may not exactly match corresponding values as a result of independent rounding. Tcf = Trillion cubic feet.
Source: U.S. Energy Information Administration analysis based on Lloyd’s List Intelligence, Suez Canal Authority (with EIA conversions).
Liquefied natural gas (LNG)
LNG flows through the Suez Canal in both directions were 1.2 Tcf in 2016, accounting for 9% of total LNG transported worldwide.
LNG flows through the Suez Canal in both directions were 1.2 trillion cubic feet (Tcf) in 2016, accounting for about 9% of total LNG traded worldwide. Southbound LNG transit mostly originates in Nigeria, France (as re-exports), and Trinidad and Tobago, mostly destined for Egypt, Jordan, and Japan, which combined account for more than 65% of the total southbound LNG imports through the canal. Nearly all of the northbound transit (99%) is from Qatar and is mainly destined for European markets. The rapid growth in LNG flows through the Suez Canal after 2008 represents the expansion of LNG exports from Qatar. LNG flows through the Suez Canal in both directions have declined from their peak of almost 2.1 Tcf in 2011. The decrease mostly reflects the fall in northbound LNG flows and is consistent with LNG import data for the United States, which show that total LNG imports fell dramatically between 2011 and 2016. U.S. LNG imports from Qatar fell from 91 billion cubic feet in 2011 to zero in 2014 and have remained at this level since then. The changes reflect growing domestic natural gas production in the United States, a decrease in LNG demand in some European countries, and strong competition for LNG in the global market. As a result, Suez LNG flows as a share of total LNG traded worldwide fell to 9% in 2016, compared with 18% in 2011.
Figure 5. Map of Suez Canal/SUMED pipeline Source: U.S. Energy Information Administration, IHS EDIN.

Bab el-Mandeb
Closing the Bab el-Mandeb Strait could keep tankers in the Persian Gulf from reaching the Suez Canal and the SUMED Pipeline, diverting them around the southern tip of Africa.
The Bab el-Mandeb Strait is a chokepoint between the Horn of Africa and the Middle East, and it is a strategic link between the Mediterranean Sea and the Indian Ocean. The strait is located between Yemen, Djibouti, and Eritrea, and it connects the Red Sea with the Gulf of Aden and the Arabian Sea. Most exports from the Persian Gulf that transit the Suez Canal and the SUMED Pipeline also pass through Bab el-Mandeb. An estimated 4.8 million b/d of crude oil and refined petroleum products flowed through this waterway in 2016 toward Europe, the United States, and Asia, an increase from 3.3 million b/d in 2011. The Bab el-Mandeb Strait is 18 miles wide at its narrowest point, limiting tanker traffic to two 2-mile-wide channels for inbound and outbound shipments. Closure of the Bab el-Mandeb could keep tankers originating in the Persian Gulf from reaching the Suez Canal or the SUMED Pipeline, diverting them around the southern tip of Africa, which would add to transit time and cost. In addition, European and North African southbound oil flows could no longer take the most direct route to Asian markets via the Suez Canal and Bab el-Mandeb.
Table 5. Bab el-Mandeb oil flows, 2011-16 million b/d 2011 2012 2013 2014 2015 2016 Total oil flows 3.3 3.6 3.8 4.3 4.7 4.8 Northbound 2.0 2.0 2.1 2.2 2.5 2.8 Southbounds 1.3 1.6 1.7 2.1 2.2 2.0 Note: Totals may not exactly match corresponding values as a result of independent rounding.
Sources: U.S. Energy Information Administration analysis based on Lloyd’s List Intelligence, Suez Canal Authority, and GTT, using EIA conversion factors.
Figure 6. Map of Bab el-Mandeb Source: CIA Factbook
Turkish Straits
Although still an important chokepoint for petroleum liquids transit from the Caspian Sea region, the Turkish Straits have seen declining transit volumes since 2011, falling to 2.4 million b/d in 2016. Oil moving through these straits supplies Western and Southern Europe.
The Turkish Straits, which includes the Bosporus and Dardanelles waterways, divide Asia from Europe. The Bosporus is a 17-mile waterway that connects the Black Sea with the Sea of Marmara. The Dardanelles is a 40-mile waterway that links the Sea of Marmara with the Aegean and Mediterranean Seas.17 Both waterways are located in Turkey and supply Western and Southern Europe with oil from Russia and the Caspian Sea region. An estimated 2.4 million b/d of crude oil and petroleum products flowed through the Turkish Straits in 2016. More than 80% of this volume was crude oil. These Black Sea ports are among the primary oil export routes for Russia and other Eurasian countries including Azerbaijan and Kazakhstan. Oil shipments through the Turkish Straits decreased from 2.9 million b/d in 2011 to 2.4 million b/d in 2016. At its peak, more than 3.4 million b/d transited the straits in 2004, but the volume that traveled through the Turkish Straits fell in the mid-2000s as Russia shifted crude oil exports away from the Black Sea and toward the Baltic ports. Subsequent increases in production and exports from Azerbaijan and Kazakhstan resulted in an increase in shipments through the Turkish Straits, but the increasing trend did not last: Turkish Straits have seen a steady decrease in traffic over the past five years. These volumes may increase in the future as Kazakhstan’s production of crude oil increases and the country exports more crude oil via Black Sea. EIA expects Kazakhstan’s crude oil production to increase through at least the end of 2018 as volumes from the country’s Kashagan field continue to rise. Only half a mile wide at the narrowest point, the Turkish Straits are among the world’s most difficult waterways to navigate because of their sinuous geography. About 48,000 vessels transit the straits each year, making this area one of the world’s busiest maritime chokepoints.18 Commercial shipping has the right of free passage through the Turkish Straits in peacetime, although Turkey claims the right to impose regulations for safety and environmental purposes. Bottlenecks and heavy traffic also create problems for oil tankers in the Turkish Straits.
Figure 7. Map of Turkish Straits Source: U.S. Government

Panama Canal
The Panama Canal is not a significant route for U.S. petroleum trade. The recently completed expansion of the canal is unlikely to significantly change crude oil and petroleum product flows, with the exception of U.S. propane exports. Crude oil and petroleum liquids tankers accounted for a small portion of total transit traffic through the canal in 2016.
The Panama Canal is an important route connecting the Pacific Ocean with the Caribbean Sea and the Atlantic Ocean. The canal is 50 miles long and only 110 feet wide at its narrowest point—the Culebra Cut—at the Continental Divide.19 More than 13,000 vessels transited the Panama Canal in fiscal year 2016, representing roughly 204 million tons of cargo.20 Goods originating in or traveling to the United States accounted for more than 67% of the total shipments passing through the Panama Canal during 2016; China’s share was a distant second at roughly 19%.21 Alternatives to the Panama Canal include the Straits of Magellan, Cape Horn, and Drake Passage at the southern tip of South America, but these routes would significantly increase transit times and costs, adding about 8,000 miles of travel. Although petroleum and petroleum products represented 27% of the principal commodities that crossed through the Panama Canal from the Atlantic to the Pacific in 2016, that canal is not a significant route for global petroleum and petroleum product transit. Northbound (Pacific to Atlantic) traffic of petroleum and petroleum products accounted for only 9% of the total products traveling through the canal.22 In 2015, 1.7% of total global maritime petroleum and petroleum product flows went through the Panama Canal. According to the Panama Canal Authority, 921,000 b/d of petroleum and petroleum products were transported through the canal in fiscal year 2016, of which 843,000 b/d were refined products and the remainder was crude oil.23 About 84% of total petroleum (775,000 b/d) went southbound from the Atlantic to the Pacific in 2016.24 Some oil tankers, such as the ULCC (Ultra Large Crude Carrier) class tankers, can be nearly five times larger than the maximum capacity of the canal. To make the canal more accessible, the Panama Canal Authority, the body that operates the Canal, undertook an expansion program that was completed in June 2016. With the expansion, the Panama Canal Authority inaugurated a third set of locks that allows larger ships to transit the canal. This expansion was the first one since the canal was completed in 1914.25 The canal expansion involved deepening and widening some portions of the canal and constructing an additional, larger set of locks. Unlike the old lock system, which had two lanes of side-by-side traffic, the new set of locks is one large lane and allows four transits per day, supplementing the 25 daily transits using the older lock system. The wider and deeper navigation channels and larger locks allow for the transit of larger vessels through the canal. The maximum vessel dimensions in the old lock system, known as Panamax vessels, limited tankers to those of approximately 300,000 to 500,000 barrels of capacity of petroleum products such as gasoline and diesel fuel. The newer lock system allow the larger Neopanamax vessels to transit the canal, with estimated petroleum product capacities of 400,000 to 600,000 barrels (Figure 8). The expansion of the Panama Canal is not likely to affect crude oil and petroleum product flows in the future, with the exception of U.S. propane exports. Previously, the size limitations of the canal created logistical bottlenecks for U.S. propane exports travelling to markets in Asia, necessitating ship-to-ship transfers. The new, larger Panama Canal locks allow most Very Large Gas Carriers (VLGC), the type of ship that carries propane and other hydrocarbon gas liquids (HGL), to transit.
Figure 8. Panama Canal and Lock System Source: U.S. Energy Information Administration
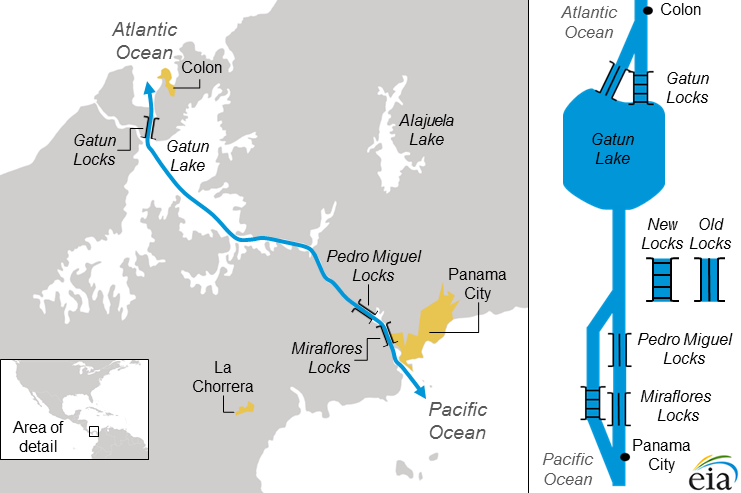
Figure 9. Panama Canal size restrictions
Figure 10. Map of Panama Canal Source: CIA World Factbook

Table 6. Panama Canal and oil flows, 2011-16 thousand barrels per day 2011 2012 2013 2014 2015 2016 Panama Canal total flows total oil 768 813 863 877 1031 934 crude oil 121 120 92 133 134 79 refined products 647 693 771 744 897 855 Panama Canal southbound flows total oil 609 696 719 701 826 785 crude oil 69 72 40 48 60 47 refined products 541 624 679 653 766 738 Panama canal northbound flows total oil 158 117 144 176 205 149 crude oil 52 48 52 84 74 32 refined products 106 69 92 91 131 116 Notes: Totals may not equal the sum of the components due to independent rounding. Data for the Panama Canal are by fiscal years (October 1 to September 30).
Sources: U.S. Energy Information Administration analysis based on Lloyd’s List Intelligence, Panama Canal Authority (with EIA conversions).26
Trans-Panama Pipeline
The Trans-Panama Pipeline (TPP), operated by Petroterminal de Panama, S.A. (PTP), is located outside the former Canal Zone near the Costa Rican border. It runs from the port of Charco Azul on the Pacific coast to the port of Chiriqui Grande in Bocas del Toro, Panama, on the Caribbean Sea. The pipeline began operating in 1982 with the original purpose of facilitating crude oil shipments from Alaska's North Slope to refineries in the Caribbean and in the U.S. Gulf Coast.27 However, in 1996, the TPP was shut down as oil companies began shipping Alaskan crude oil along alternate routes. In August 2010, the flow of the TPP was reversed, and the pipeline now transports oil from the Caribbean to the Pacific.28 In 2012, BP and PTP signed a seven-year transportation and storage agreement allowing BP to lease storage facilities located on the Caribbean and Pacific coasts of Panama and to use the pipeline to transport crude oil to U.S. West Coast refiners. According to PTP, BP has leased 5.4 million barrels of PTP's storage and committed to east-to-west shipments through the pipeline averaging 100,000 b/d. The route reduces the transport time and the costs of ships that have to travel around Cape Horn at the southern tip of South America to get to the U.S. West Coast.29 Shell, also reportedly signed a three-year agreement to lease capacity in early 2017, gaining access to storage and transshipment facilities, the pipeline network, and tanker docks for oil loading.30 According to Lloyd’s List Intelligence, 111,000 b/d of crude oil was transported through the pipeline to the port of Charco Azul in 2016.
Danish Straits
The Danish Straits are a vital route for Russian seaborne oil exports to Europe.
The Danish Straits are a series of channels that connect the Baltic Sea to the North Sea. They are an important route for Russian seaborne oil exports to Europe. An estimated 3.2 million b/d of crude oil and petroleum products flowed through the Danish Straits in 2016. Russia shifted a significant portion of its crude oil exports to its Baltic ports after opening the port of Primorsk in 2005. In 2011, Primorsk oil exports accounted for almost half of all exports through the Danish Straits, although the volume fell to 32% in 2016. A small amount of oil (less than 50,000 b/d), primarily from Norway and the United Kingdom, also flowed eastward to Scandinavian markets in 2016.
Figure 11. Map of Danish Straits Source: CIA Factbook
Cape of Good Hope
Although not a chokepoint, the Cape of Good Hope is a major global trade route. Crude oil flows around the Cape accounted for about 9% of all seaborne-traded oil.
The Cape of Good Hope, located on the southern tip of South Africa, is a significant transit point for oil tanker shipments around the globe. EIA estimates about 5.8 million b/d of seaborne-traded crude oil moved around the Cape of Good Hope in both directions in 2016. In 2015, crude oil transit around the Cape accounted for roughly 9% of global maritime trade of 5.1 million b/d. In 2016, 4.3 million b/d of crude oil around the world moved eastbound, originating mostly from Africa (2.2 million b/d) and from South America and the Caribbean (1.6 million b/d). Eastbound crude oil flows were nearly all destined for Asian markets (4.1 million b/d). In the opposite direction, nearly all westbound flows originated from the Middle East (1.5 million b/d), mostly destined for the Americas, with the United States accounting for the majority of the total (75% of total flows). Europe was the destination for less than 12% of the flows. The Cape of Good Hope is also an alternate sea route for vessels traveling westward that want to bypass the Gulf of Aden, Bab el-Mandeb Straits, and/or the Suez Canal. However, diverting vessels around the Cape of Good Hope increases costs and shipping time. For example, closure of the Suez Canal and the SUMED Pipeline would require oil tankers to divert around the Cape of Good Hope, adding approximately 2,700 miles to transit from Saudi Arabia to the United States, which would increase both costs and shipping time, according to the U.S. Department of Transportation.31 According to the International Energy Agency (IEA), shipping around Africa would add 15 days of transit to Europe and 8—10 days to the United States.32
Table 7. Crude oil transit via the Cape of Good Hope, 2011-16 million b/d 2011 2012 2013 2014 2015 2016 Total flows 4.7 5.4 5.1 4.9 5.1 5.8 Eastbound 2.9 3.7 3.7 3.8 4.1 4.3 Westbound 1.8 1.7 1.4 1.1 1.0 1.5 Notes: Totals may not equal the sum of the components due to independent rounding.
Sources: U.S. Energy Information Administration analysis based on Lloyd’s List Intelligence
Notes
Data presented in the text are the most recent available as of July 25, 2017
Data are EIA estimates unless otherwise noted.
Endnotes
South Korea imported some 353,000 bpd of Iranian crude last month, up 17 percent on March ahead of the removal of sanction waivers that granted South Korea and another seven countries to legally import certain amounts of Iranian crude despite U.S. sanctions.
A month earlier, South Korea’s imports of Iranian crude reached 1.2 million tons, or 8.8 million barrels which was a 23-percent increase on February and a fivefold increase on January, when Korean refiners resumed their purchases of Iranian crude.
Reuters reports the monthly rise will be followed by a sharp drop this month as Washington did not renew the sanction waivers for Iranian oil importers. The picture would be the same for Japan as the two are the staunchest U.S. allies in Asia and have been careful to maintain their traditionally strong relationship with Washington.
Both South Korea and Japan stopped importing Iranian oil well before the U.S. sanctions snapped back last November and then they waited for a couple of months before they started importing oil from Iran while the waivers lasted. Neither South Korea nor Japan expect any major negative impact from the cancelation of the waivers, officials from the two countries have said. However, now they will have to find an affordable alternative to Iranian oil, especially condensate, of which South Korea is a major importer.
One obvious alternative would be U.S. light crude, which is comparable in quality with Iranian condensate. South Korea is already the second-largest oil client of the U.S. as of the end of 2018, after Canada and ahead of China. The average daily intake of U.S. crude in South Korea last year was 236,000 bpd. This is actually lower than what South Korea imported from Iran during the waiver period, at 235,533 bpd for January to April this year, but now that the waivers have been removed, shipments of U.S. light will most likely increase.
By Irina Slav for Oilprice.com
More Top Reads From Oilprice.com:
The marine industry’s January 2020 shift to using very low sulfur fuel oil (VLSFO) to power ships worldwide will launch a one- to five-year disruption in oil and refined products markets, according to a study released Thursday by Boston Consulting Group.
The International Maritime Organization (IMO)’s mandated switch will require fuels to have a sulfur content below 0.5%, compared with 3.5% now. It aims to improve human health by reducing air pollution from sea-going vessels.
The changeover may increase profits for refiners, especially on the U.S. Gulf Coast, where plants are designed to process high-sulfur crudes. It could also benefit producers of shale oil, which has a lower sulfur content than other varieties, the study found.
Conversely, prices for high-sulfur fuel oil (HSFO) or bunker fuel, with a maximum sulfur content of 3.5%, will fall as demand erodes, according to the study.
“The effects will be more than made up for by higher market prices for VLSFO and middle distillates, leaving most refiners, particularly complex refiners on the U.S. Gulf Coast, with substantially higher margins than they had before the disruption,” it said.
Prices for crude oil from shale fields will benefit from the transition, the study said, and “command a rising price premium, due to a sulfur concentration that is lower than that of oil from other sources.”
The shortest period for the transition would be one year if the IMO, a United Nations body regulating the shipping industry, were to postpone the start to 2022, allowing refiners and shippers more time to prepare for the change, which was first announced in 2016.
The longest period – five years – would be expected if the world economy falls into recession and shippers widely do not comply with the regulation, narrowing the expected price spread between HSFO and VLSFO.
Delek US's Crude Oil Gathering System In The Midland Basin
Crude oil gathering systems do just that — they gather crude from multiple well sites — but the drivers behind their initial development can vary widely. Some gathering systems are developed by oil producers to reduce their use of trucks and more efficiently transport increasing volumes of crude from the lease to takeaway pipelines. Others are the brainchildren of savvy midstream companies that see an opportunity to serve multiple producers in a fast-growing production area. And then there are systems like the one refiner Delek US is now expanding in the Permian’s Midland Basin near the company’s Big Spring, TX, refinery. It’s designed to feed locally produced crude directly to that refinery — and possibly other Delek refineries too — and may potentially be used to help fill a long-haul takeaway pipeline that Delek still hopes to co-develop with partners.
Delek is a mid-size refiner based in Brentwood, TN — also home to Dolly Parton and a number of other country music stars. The company owns and operates four refineries: El Dorado, AR (capacity, 80 Mb/d); Tyler, TX (75 Mb/d), Krotz Springs, LA (74 Mb/d), and Big Spring, TX (73 Mb/d). For many years now, the El Dorado refinery has been receiving a portion of its crude oil needs from Delek’s 600-mile SALA gathering system in southern Arkansas and Louisiana; that system in 2018 transported more than 16 Mb/d, on average, most of it to the El Dorado refinery. Since early 2018, Delek has been developing an approximately 200-mile gathering system in the Midland Basin. The first elements of that $210 million system were completed in the second half of 2018 and have been in service for several months. The rest is under construction and expected to be finished this summer. The system’s initial throughput capacity is 150 Mb/d; with the ongoing build-out, that will double to 300 Mb/d.
The new gathering system already provides much of the crude needed by Delek US’s Big Spring refinery (red dot in Figure 1), which is one of only two refineries located within the Permian Basin proper, the other being HollyFrontier’s 100-Mb/d Navajo refinery (blue dot) in Artesia, NM. (As we mentioned at the outset, we also think the new Big Spring gathering system may have the potential to feed Midland-sourced barrels to other Delek refineries too. More on that in a moment.) Delek so far has released only a few specifics about the system, which runs (or soon will run) through parts of four West Texas counties — Howard, Borden, Martin and Midland (yellow rectangles) — and gathers crude from wells on the more than 200,000 acres dedicated to the system. The company has indicated that the system will include at least 650 Mbbl of storage capacity.

Figure 1. Delek’s Big Spring Gathering System, and Selected Pipelines and Pipeline Projects. Source: RBN
The Big Spring refinery (photo below) that the new gathering system feeds is located in Howard County, about 40 miles east of Midland. The refinery was acquired by Delek US in July 2017 as part of its purchase of the rest of Alon Energy USA in a Texas two-step style of company takeover. Big Spring is Delek’s smallest refinery by capacity (albeit just barely), but it’s also its most sophisticated. Put another way, Big Spring is chock full of equipment to break down two readily available, local crude types — West Texas Intermediate (WTI) and West Texas Sour (WTS) into a wide range of valuable refined products, including gasoline, ultra-low-sulfur diesel (ULSD) and jet fuel. [As we said last June in Heavy, WTS — the heavier, more sour counterpart to WTI — has a lower API gravity than WTI (32 to 35 degrees vs. 37 to 42) and higher sulfur content (1.5% vs. 0.45%), and therefore requires a more intense degree of refining to break the crude down into the most valuable mix of refined products — something the Big Spring refinery can easily do.]
A major driver behind the Big Spring gathering system’s development is to provide Delek’s Big Spring refinery with access to Midland crude directly from wells, which will enable the company to better control oil quality. As we said in Refinery Yields Forever, the output of a refinery (how much gasoline, diesel, jet fuel, etc. it produces per barrel of crude) — and, as a result, the refinery’s profitability — depends on a number of factors, including the refinery’s equipment, how the refinery is operated, and the characteristics of the crude oil (API gravity, sulfur content, etc.) that the refinery processes. In You Can’t Always Get Out What You Put In, we explained that crude oil characteristics can vary widely depending on where the oil is produced — even within a major production area like the Permian — and the commingling of crudes from various sources in big, long-haul pipelines can leave a refinery at the end of those pipes with crude that is less than ideal for its needs.

Delek US’s Big Spring Refinery. Source: Delek
By owning the gathering pipe, and sophisticated electronics and measuring devices supporting it, Delek gains a line-of-sight directly to the source barrel. It knows where the high-gravity and low-gravity wells are, and which are the best wells to get flowing into its refinery. Based on what crude slate it wants to run, it could segregate some barrels in storage, picking which to use for the refinery, and possibly turning away crude that doesn’t fit its specific needs into the downstream pipes the system connects to. Delek also knows what each individual well is producing, and has the ability to schedule volumes into pipes and its refinery, giving it a huge degree of flexibility (also responsibility!). But instead of producers telling Delek, say, five days late that they are a bit short of production this month, Delek will know every day what is coming out of the ground.
We should note here that we also see the potential for the Midland crude gathered on Delek’s new Big Spring system to find its way to one and possibly two or three other Delek refineries. Our understanding is that Delek holds firm capacity on Energy Transfer’s 40-Mb/d Amdel Pipeline (yellow line in Figure 1) from the Midland/Big Spring area to Nederland, TX; from there, crude from the Big Spring system could be barged up to Delek’s Krotz Springs refinery in Louisiana. We also know that Plains All American’s Mesa Pipeline (green line) and Sunrise Pipeline (red line) — both of which tie into Plains’ large Basin Pipeline System (pink lines) — have connections with the Big Spring refinery, which suggests that Mesa and Sunrise could potentially be used to transport crude from the Big Spring gathering system to Colorado City, TX. From there, other pipes could be used to move the crude to Delek’s Tyler refinery, and maybe to its El Dorado refinery too.
As for the potential tie-in between the Big Spring gathering system and a new long-haul pipe to the coast that we mentioned in our intro, Magellan Midstream Partners, Energy Transfer, MPLX and Delek announced in September 2018 that they were planning the 600-mile Permian Gulf Coast (PGC) Pipeline (dashed orange line in Figure 1), which would’ve had the capacity to transport between 600 Mb/d and 1 MMb/d from Midland to both Houston and Energy Transfer’s terminal in Nederland, TX. However, that plan later unraveled — Magellan, Energy Transfer and Delek withdrew from the PGC project in the first quarter of this year and said they were exploring other alternatives, and MPLX announced on May 8 that it has signed a letter of intent to participate in the 1-MMb/d-plus Wink-to-Webster Pipeline (dashed blue line) being co-developed by Plains, ExxonMobil and Lotus Midstream. (We should note that the planned Wink-to-Webster pipe will run through Midland — and very near the new Big Spring gathering system — on its way to the Gulf Coast.)
In sum, Delek US appears to have taken an innovative approach to gathering-system development — its focus being on gathering Midland crude with specific characteristics for its Big Spring refinery — and possibly for other Delek refineries as well. By calibrating the Big Spring refinery to optimize output when running locally sourced crude with specific qualities, and then delivering that crude directly from nearby wells via a company-owned gathering system, Delek can have a high degree of confidence that the refinery will always be operating at the top of its game.
In addition to the crude-quality benefit, the Big Spring gathering system (1) will allow Delek to receive the revenue associated with gathering crude, (2) will expand Delek’s revenue- and profit-generating logistics business, and (3) provides a potential source of barrels for a new long-haul pipeline from the Permian to the Gulf Coast that Delek hopes to be involved in co-developing. Delek Logistics Partners, a master limited partnership (MLP) in which Delek US holds a more than 60% ownership interest, is managing the development of the new gathering system, and Delek has indicated that it is likely to “drop down” ownership of the gathering system to the MLP when the system is fully operational. In our next blog in this series, we’ll look at another major gathering system in the nation’s hottest crude oil production area.
https://rbnenergy.com/have-it-all-part-5-delek-uss-crude-oil-gathering-system-in-the-midland-basin
Russia's Transneft to compensate buyers for dirty oil, but they must prove loss
Russia’s state pipeline monopoly Transneft will compensate all parties for losses incurred from contaminated oil, but they must prove the damage, a government official said on Thursday, as the first European refinery declared force majeure.
Russia’s oil export flows have been disrupted since April when high levels of organic chloride were found in crude pumped via the Druzhba pipeline to the Baltic port of Ust-Luga and other European countries.
The Druzhba pipeline splits in Belarus into a northern spur to Poland and Germany and a southern leg via Ukraine to Slovakia, Hungary and the Czech Republic. Only Hungary has resumed test flows to see if its refinery equipment can withstand the contaminated oil.
Druzhba can pump 1 million barrels of oil per day (bpd) or the equivalent of 1 percent of global oil demand.
Transneft has repeatedly said that oil firms which use chloride to boost oil output were to blame for contamination, but on Thursday, Russia said Transneft would foot the bill.
“Of course - and sadly - Transneft,” Russian Deputy Prime Minister Dmitry Kozak told reporters when asked who would pay after a meeting with his Belarusian counterpart Igor Lyashenko in Moscow. Transneft head Nikolai Tokarev also attended the meeting.
Ukraine and Belarus both said they will ask Transneft for compensation. Stoppage of oil flows not only affects refineries but also budget revenues from a loss of transit fees.
Kozak said on Thursday that Russia had not yet calculated the cost of the damage and it would take three to four weeks to do so.
“This is not a judicial dispute, we will find a compromise,” Kozak said. “Everyone who can prove real losses will, of course, be compensated.”
He said Poland, Ukraine, Hungary and Slovakia were currently waiting and had not yet issued demands for compensation.
According to traders, while Druzhba remains shut, Russia is losing $80 million a day. For the buyers of an estimated 19 million barrels of contaminated crude which is stuck in the pipeline and loaded on tankers, it’s a $1.2 billion question.
FIRST VICTIM
According to the International Energy Agency, the impact on European refinery throughput in the second quarter of 2019 from the contaminated crude is seen at roughly 250,000 barrels per day, under 2% of the continent’s product demand.
Some countries, including the Czech Republic, have had to use strategic oil reserves to make up for lost Russian barrels, while Poland has increased seaborne oil imports.
Total’s 230,000 barrel-per-day Leuna refinery in Germany, which usually receives Urals crude via Druzhba, declared force majeure on refined product shipments on Thursday as a result of the contamination.
Total had no immediate comment.
Industry monitor Genscape said it detected abnormal emissions at the plant and decreased furnace stack activity on the 112,000 bpd vacuum distillation unit. “Activity from all other monitored units has remained at operational levels,” Genscape said on Thursday.
Kozak said it will take 22 days to clean one branch of Druzhba and seven days for the other, without specifying which was which. He added that the prime ministers of Russia and Belarus were due to meet next week to discuss the issue.
China has issued a second batch of refined fuel export quotas for this year totaling 23.79 million tonnes, about 30 percent more than the first batch, trading sources briefed on the matter said.
The quotas comprised 9.09 million tonnes of gasoline, 9.175 million tonnes of diesel and 5.525 million tonnes of jet fuel, the two sources said.
China manages annual fuel exports by issuing quotas progressively in batches.
The increased quotas come as China has been boosting its exports of refined products, with record refinery production exceeding domestic fuel demand growth.
The fuel surplus is set to grow further, as privately owned Hengli Petrochemical Co Ltd’s 400,000 barrels-per-day plant in northeast China ramps up to full capacity later this month.
The second batch of quotas, which will be valid until the end of the year, brings the total issued so far for 2019 to 42.15 million tonnes.
All the quotas were issued to state oil companies - CNPC, Sinopec, CNOOC, Sinochem and China National Aviation Fuel, the sources said.
They will also fall under the category of general trade, under which refiners will receive tax refunds for exports of fuel products, they said.
OPEC’s key ally in all production cut agreements since 2017—Russia—appears to have somewhat reluctantly agreed to cut output in each of the OPEC/non-OPEC pacts over the past two years.
Now that the next OPEC and allies’ meeting at the end of June is set to discuss a potential production increase to offset mounting supply disruptions, instead of cuts, Russia seems to be all in on joining a pact to reverse some or all of the current 1.2 million bpd cuts that OPEC and its Moscow-led non-OPEC allies are implementing until June this year.
Russia is not giving away any official indications as to its thinking about the OPEC+ deal. Comments and hints from officials and companies, however, indicate the usual reluctance to continue cutting production once the current agreement expires in June.
A panel of OPEC and non-OPEC partners is meeting in Jeddah, Saudi Arabia, this weekend, to discuss the state of the oil market. No one expects any decision to be taken at this meeting, which is a kind of a preparatory meet-up before the full OPEC and non-OPEC line-up gathers in Vienna on June 25 and 26.
But at this weekend’s meeting, discussion is expected to revolve around a possible production increase after the end of the U.S. sanction waivers to all Iranian oil buyers. Talk of raising—instead of cutting—production would be in line with Russia’s ambition to resume pumping more as its companies benefit from higher production as much as from higher oil prices and have seen their new field production plans stalled by Russia’s commitments to the OPEC+ deals.
Russia is likely to tell the panel meeting in Jeddah that it could increase its production by 300,000 bpd in a short period of time, Maksim Nechaev, Russia director for IHS Markit, told Bloomberg this week.Related: The IEA's Dire Warning For Energy Markets
Russia has a far from perfect track record when it comes to keeping its commitment to the OPEC+ cuts. It always argues that due to weather and geological challenges, it wants gradual reduction until it reaches its quota. In the current cuts, Moscow hit the reduction target only this month—one month before the six-month pact expires.
Looking beyond June, Russia has been sending mixed messages to the market in recent months, leaving the market and analysts guessing how Vladimir Putin will approach the deal this time.
Russia’s biggest oil producer Rosneft, which alongside other Russian companies is said to be reluctant to continue to cut production after June, said this week in its Q1 earnings release that it “has substantial potential to promptly increase production” if restrictions are eased.
Russia’s position on the deal will probably not be known until the very day of the meeting with OPEC at the end of June, so the market and analysts will continue to speculate on the fate of the pact for another month and a half.
Asked about the meeting in Jeddah this weekend, Russian Energy Minister Alexander Novak said on Wednesday that the OPEC+ alliance feels that it’s still too early to assess how the end of the U.S. waivers for Iranian buyers will impact the oil market as of this month. There are too many uncertainties in the market and it’s too early to talk about possible recommendations to the full OPEC+ meeting at end-June. The Jeddah meeting will assess the current market situation and estimates for future demand and supply, and exchange views, Novak said.Related: OPECs Spare Capacity Could Be Put To The Test
This time around, Russia’s goal to start reversing the cuts it has just achieved coincides with expectations of global supply declines, due to the tightened U.S. sanctions on Iran’s oil exports, plunging Venezuelan production, fear of outages in conflict-torn Libya, and concerns about global oil supply routes with the heightened tension in the Middle East’s most important oil waterways.
“Russia’s interest in raising oil output now coincides with the interest of Saudi Arabia,” Dmitry Marinchenko, a senior director at Fitch Ratings, told Bloomberg.
Saudi Arabia has pledged to fulfill all customer requests for additional barrels from buyers, but it has also said that it won’t be rushing into boosting production in advance until it actually sees Iranian barrels coming off the market and buyers demanding more oil.
An uncontrolled production ramp-up could send oil prices sharply down on oversupply concerns, and this is the last thing Saudi Arabia needs now as it aims to keep oil prices at around and over $70 a barrel Brent for budget revenue purposes.
This weekend’s meeting will be the first official gathering of OPEC and non-OPEC ministers since the U.S. ended the waivers for Iranian oil exports. Although no decisions are expected to be taken in Jeddah, the partners in the deal will exchange views that could be the start of negotiations leading to the end-June meeting.
https://oilprice.com/Energy/Energy-General/Russia-Hints-At-OPEC-Deal-Exit.html
Enbridge Inc, Canada’s largest pipeline operator, beat analysts’ estimates for quarterly profit on Friday, as it benefited from transporting more oil and gas across its pipelines.
The company said it transported 2.7 million barrels of crude oil per day (bpd) on its key Mainline system across Canada and the United States during the first quarter, up from 2.6 million bpd in the year-ago quarter.
Enbridge has been working on replacement works on its Line 3 pipeline project that would run from Alberta to Wisconsin and connect to pipelines carrying crude to refineries in the United States.
Construction costs for the project were tracking below budget in Canada and above budget in the U.S. due to permitting delays in Minnesota, the company said.
Adjusted earnings rose to C$1.64 billion ($1.22 billion) in the first quarter ended March 31, from C$1.38 billion in the year-ago quarter.
On an adjusted per share basis, the company earned 81 Canadian cents, while analysts’ on average had expected 72 Canadian cents, according to IBES data from Refinitiv.
Oilfield services provider Weatherford International Plc, burdened by a heavy debt load and years of losses, said on Friday it would file for Chapter 11 bankruptcy protection.
The company, which at its peak was valued at more than $50 billion, never recovered from the 2014 oil price collapse. Efforts under Chief Executive Officer Mark McCollum to quickly sell assets and pare debt struggled.
Weatherford expects to reduce its long-term debt by more than $5.8 billion, through the restructuring.
Weatherford’s shares plunged 61% to 14 cents in extended trading on Friday after the company reported the plan to seek protection from creditors and a wider quarterly loss.
For the period ended March 31, it posted a loss of $481 million, or 48 cents a share, compared with a loss of $245 million, or 25 cents, a year earlier. Revenue fell 5.4 percent to $1.35 billion.
Rising losses had left Weatherford without access to suitable financing and sparked the departure of key employees, it said in a securities filing. It failed to hit first quarter cost reduction targets due to “market headwinds” and difficulties cutting its manufacturing operations, it said.
Weatherford provides oil-and-gas well construction and completion, drilling and evaluation, and production services. It had about 26,000 employees at the end of March.
When asked on an earnings call in February if it was considering filing for bankruptcy protection, McCollum, the former finance chief of rival Halliburton, said, “I don’t waste a lot of time thinking or planning how to fail.”
Weatherford reported total liabilities of $10.6 billion and assets of $6.52 billion on March 31. It has not reported a quarterly profit in four years.
The company said bit.ly/2VvvO5y it expects to enter into two processes of debtor-in-possession financing, including a revolving credit facility of up to $750 million provided by banks or other lenders and a loan facility of up to $1 billion.
Weatherford said it will continue operating its businesses without any disruption to its customers and other partners.
U.S. energy firms this week reduced the number of oil rigs operating for the third time in four weeks even as crude production forecasts increase despite some drillers cutting spending.
Drillers cut two oil rigs in the week to May 10, bringing the total count down to 805, General Electric Co’s Baker Hughes energy services firm said in its closely followed report on Friday.
That put the U.S. rig count, an early indicator of future output, below the 844 drilling a year ago.
The rig count has declined over the past five months as independent exploration and production companies cut spending on new drilling as they focus more on earnings growth instead of increased output.
Major oil companies, like Exxon Mobil Corp and Chevron Corp, however, are boosting their presence, particularly in the Permian, the largest U.S. shale oil field.
The Energy Information Administration this week raised its forecast for U.S. crude output, projecting it would reach a record 12.5 million barrels per day in 2019 and 13.4 million bpd in 2020, up from the current all-time high of 11.0 million bpd.
U.S. crude futures, meanwhile, were trading around $62 per barrel on Friday, leaving the contract little changed for the week as tightened global supplies overshadowed trade tensions stoked by a U.S. move to hike tariffs on Chinese goods.
Looking ahead, crude futures were trading just below $62 a barrel for the balance of 2019 and above $59 in calendar 2020.
U.S. financial services firm Cowen & Co this week said that projections from the exploration and production (E&P) companies it tracks point to a 5 percent decline in capital expenditures for drilling and completions in 2019 versus 2018.
Cowen said independent producers expect to spend about 11 percent less in 2019, while major oil companies plan to spend about 16 percent more.
In total, Cowen said all of the E&P companies it tracks that have reported will spend about $81.9 billion in 2019 versus $86.4 billion in 2018.
Year-to-date, the total number of oil and gas rigs active in the United States has averaged 1,031. Most rigs produce both oil and gas.
Analysts at Simmons & Co, energy specialists at U.S. investment bank Piper Jaffray, however, forecast the average combined oil and gas rig count will slide from 1,032 in 2018 to 1,019 in 2019 before rising to 1,097 in 2020.
That is the same as Simmons predictions since early April.
Oilfield services provider Weatherford International Plc said on Monday it would soon have debtor-in-possession financing that would allow it to file a plan for Chapter 11 bankruptcy and emerge quickly with little debt.
The company said it expects to enter into two processes of debtor-in-possession financing, including a revolving credit facility of up to $750 million provided by banks or other lenders and a loan facility of up to $1 billion.
As part of the restructuring plan, all its existing unsecured notes will be exchanged for 99% of shares of the reorganized company and $1.25 billion of new senior unsecured notes, as part of its Chapter 11 bankruptcy.
The new unsecured notes will have a maturity period of seven years, it said in an SEC filing.
Rising losses had left Weatherford without the ability to roll-over its debt and had sparked the departure of key employees needed to execute organizational changes, it said on Friday.
Weatherford, which disclosed plans to seek bankruptcy protection from creditors on Friday citing $10.6 billion in liabilities and $6.52 billion in assets, said existing secured funded debt and unsecured revolving credit facility debt will be repaid full in cash.
According to Monday’s filing, Weatherford’s existing equity will be exchanged for 1% of new stock and three-year warrants to buy 10% of the new stock.
China said on Monday it would raise tariffs on liquefied natural gas (LNG) imports from the United States amid a series of additional levies, a move that could further reduce U.S. LNG shipments to the world’s fastest growing importer of the fuel.
So far this year, only two LNG vessels have gone from the United States to China, versus 14 during the first four months of 2018 before the start of the 10-month trade war.
On Monday, China said it would boost the tariff on U.S. LNG to 25% starting June 1 versus the current rate of 10%.
That move came in retaliation for a U.S. increase on Friday in tariffs on $200 billion in Chinese goods to 25% from 10%.
Between February 2016, when the United States started exporting LNG from the Lower 48 states, and July 2018, when the trade war started, China was the third biggest purchaser of U.S. shipments of the supercooled fuel. So far this year, China is not even in the top 15.
“I expect they will have a hard time landing a tanker carrying U.S. LNG in China if they impose a 25 percent tariff on it,” said Jack Weixel, senior director at IHS Markit’s PointLogic analytics arm.
Stephen Comstock, a director at the American Petroleum Institute, which represents the oil and gas industry, said the retaliatory tariffs “dampen the prospects for the growing U.S. LNG investment, hurt U.S. workers, and benefit America’s foreign competitors.”
Natural gas is seen as a bridge fuel between current worldwide use of much dirtier coal for power generation and industrial consumption, and renewable fuels, because it burns cleaner. It has seen massive growth in sales in recent years, particularly to Asian nations seeking to reduce their dependence on coal.
The United States, meanwhile, is the fastest-growing LNG exporter in the world, and is expected to rank third in exports in 2019 behind Qatar and Australia. China is the second biggest LNG importer in the world behind Japan.
So far, the biggest U.S. LNG producer, Cheniere Energy Inc, has not expressed major concerns about the trade war. Last week, Cheniere, which owns two of the three big operating U.S. LNG export terminals, said the trade war is “unproductive and creates some added costs for our Chinese consumers,” but it has not yet materially affected sales.
The United States and China started imposing tariffs on each other’s goods in July 2018. As the dispute heated up, China added LNG to its list of proposed tariffs in August and imposed a 10% tariff on LNG in September.
U.S. LNG sales had already been affected by a 60 percent collapse in Japan Korea Marker (JKM) LNG prices seen since September.
“Weaker JKM spot prices in Asia already killed most of the commercial reasoning for U.S. LNG sales to China. The tariff is the knockout blow,” said Ira Joseph, head of global gas and power analytics at S&P Global Platts.
Russia’s largest oil producer, Rosneft, reported on Monday a higher net income in the first quarter compared to both the fourth quarter of 2018 and Q1 2018, thanks to higher oil prices and the depreciation of the Russian ruble against the U.S. dollar.
Rosneft’s net income in Q1 2019 in rubles jumped by 61.7 percent year on year, to US$2 billion (131 billion Russian rubles), mostly attributable to higher operating profit and a foreign exchange gain.
Revenues jumped by 20.6 percent on the year in rubles, thanks to higher volumes of crude oil and petroleum products sales, which grew by 7.6 percent, and to the rise in crude oil prices in rubles, up 12.7 percent on the year, on the back of the Russian currency depreciation.
“Despite the volatility and quarterly decrease in oil prices, the decline in oil production under the OPEC+ Agreement and the Agreement on stabilization of prices for petroleum products on the domestic market, in Q1 2019 the Company demonstrated healthy financial performance in terms of both earnings growth and strong free cash flow generation,” Igor Sechin, Rosneft’s Chairman of the Management Board and CEO, said in a statement.
Despite the OPEC+ agreement, Rosneft’s production rose in the first quarter of this year compared to Q1 2018, the company said in a separate press release.
Rosneft’s Q1 2019 liquids production amounted to 4.74 million bpd, up by 3.9 percent from the first quarter of 2018, due to active development of greenfields and production ramp-up at several brownfields.
Due to the compliance with Russia’s pledge in the OPEC+ production cut deal, however, Rosneft’s output declined by 1 percent in Q1 2019 compared to Q4 2018.
Rosneft, which alongside other Russian companies is said to be reluctant to continue to cut production after June, said today that it could “promptly” raise production if restrictions are eased.
“The Company has substantial potential to promptly increase production on the back of flexible well stock and well operations management approaches. In case of external restrictions ease the Company is able to secure over 4.8 mmbbl of average daily liquids production in Russia by the year-end,” Rosneft said.
Zacks Industry Rank Indicates Bleak Prospects
The Zacks Oil and Gas Integrated International industry is part of the broader Zacks Oil - Energy sector. It carries a Zacks Industry Rank #203, which places it at the bottom 21% of more than 250 Zacks industries.
zoom Deepsea Stavanger rig; Source: BP
Norwegian oil company Aker BP has received consent from the Petroleum Safety Authority (PSA) for exploration drilling in the North Sea offshore Norway, using the Deepsea Stavanger rig.
The PSA said on Tuesday that Aker BP got the consent for exploration drilling in block 15/6 in the North Sea. The consent covers the drilling of exploration well 15/6-16 S, with options for a sidetrack and testing. Aker BP has named the well Hornet Main.
The well belongs to production license 777 where Aker BP is the operator.
The location where the well is to be drilled is in the North Sea, north of the Gina Krog field and south of Gudrun. Water depth at the site is 116 meters.
Drilling is scheduled for the second quarter of 2019 and is estimated to last at least 46 days.
The well 15/6-16 S will be drilled by Deepsea Stavanger, a semi-submersible mobile drilling rig of the GVA 7500 type, built by Daewoo Shipbuilding and Marine Engineering in South Korea.
The rig is owned and operated by Odfjell Drilling and received Acknowledgement of Compliance (AoC) from the PSA in 2017.
Earlier in May, the rig completed the well 25/11-29 S, which is located about 14 kilometers south of the Grane field and 190 kilometers west of Stavanger in the central part of the North Sea. The well was dry.
Aker BP has also recently received consent from the safety authority to drill two exploration wells in the North Sea, using the Deepsea Stavanger drilling rig.
Spotted a typo? Have something more to add to the story? Maybe a nice photo? Contact our editorial team via email.
Offshore Energy Today, established in 2010, is read by over 10,000 industry professionals daily. We had nearly 9 million page views in 2018, with 2.4 million new users. This makes us one of the world’s most attractive online platforms in the space of offshore oil and gas and allows our partners to get maximum exposure for their online campaigns.
If you’re interested in showcasing your company, product or technology on Offshore Energy Today contact our marketing manager Mirza Duran for advertising options.
Russia's Novatek expects to increase its LNG production capacity target to 70 million mt/year by 2030, up from a previous target of 57 million mt/year, company CFO Mark Gyetvay said Monday.
Speaking at the Flame conference in Amsterdam, Gyetvay said the company continued to build its resource base in northern Russia on the Yamal and neighboring Gydan peninsulas, pointing to a giant discovery late last year at the North Obskiy gas prospect with an estimated resource of 900 Bcm.
That is in addition to the existing 3.3 Tcm resource base Novatek has across its license areas.
"Our objective over the next year is to come up with a revision to 70 million mt/year by 2030," Gyetvay said.
Previously, Novatek had said it aimed to have a production capacity of 57 million mt/year by that time.
Novatek brought online its first 5.5 million mt/year LNG train at the three-train Yamal LNG facility in December 2017, and has since commissioned the second and third trains.
The company is also close to making a final investment decision on a new LNG plant -- Arctic LNG-2 -- which would have a production capacity of 19.8 million mt/year.
It is moving forward with its plans on the expectation of growing global LNG demand, which Gyetvay said could reach 700 million mt/year by 2030.
That compares with trade of around 314 million mt/year last year, according to data from industry group GIIGNL.
ARCTIC LNG-2 PARTNERS
Novatek is close to finalizing the partnership structure for Arctic LNG-2 having sold 10% to France's Total and having agreed to sell 10% stakes to China's CNPC and CNOOC.
Given that Novatek wants to keep a 60% stake in the project, that leaves 10% to sell, Gyetvay said.
"In a relatively short time we will announce a fourth partner," he said.
Novatek has been in talks with Saudi Aramco about taking a stake in the project as the country looks to potential LNG imports in the future.
FID on the project is expected early in the third quarter of 2019, he added.
In terms of cost, Arctic LNG-2 would be $700-750/mt, but including the field development cost for the feedgas the cost would be $1,050/mt, he said.
As well as producing LNG, Novatek is planning two transshipment centers -- one in the east in Kamchatka and one in the west at Murmansk -- to optimize shipping.
The Kamchatka transshipment facility is expected to begin operations around 2022, the same time as the Arctic LNG-2 project.
Permian natural gas prices have been on a wild ride lately, trading more than $5/MMBtu below zero in early April before recovering to just above zero over the last few weeks. It’s hardly a secret that the Permian’s gas market woes have been the direct result of production exceeding pipeline capacity. That situation is set to change in a few months, when Kinder Morgan starts up its 1.98-Bcf/d Gulf Coast Express Pipeline, providing much needed new takeaway capacity. And that’s not all GCX will do. Its start-up will shift huge volumes of gas toward the Texas Gulf Coast that currently flow out of the Permian to other markets, likely causing a ripple effect across more than just the West Texas gas market. Today, we look at how Kinder Morgan’s new gas pipeline will redirect significant volumes of Permian gas currently flowing north to the Midcontinent.
Before we focus on today’s topic — GCX-driven flow shifts — we first want to provide a quick update on Permian natural gas and our recent blogs on the subject. About a month ago, in Money For Nothing, Gas For Free, we outlined some of the beneficiaries of the Permian gas price crash. Since then, prices have improved somewhat in the basin, with daily average prices at the Waha Hub hovering just above zero for the past month or so (dashed green oval in Figure 1 below). The improvement has been driven largely by producers deciding to curtail their dry gas production in the basin, with Apache Corp. alone announcing it has deferred 250 MMcf/d. Before those adjustments, prices at Waha crashed to all-time low levels in early April (dashed red oval), a situation we detailed in Don’t Dream It’s Over. Prior to that dramatic event, Permian gas prices had only flirted with subzero prices, back in February (dashed orange circle, see King of Pain), after falling below zero in intraday trading for the first time ever in November 2018 (dashed purple circle; see Keep Breathin’). While we doubt that Permian gas prices will be out of the woods fully until GCX starts, it’s fair to say that the extremely negative prices were enough to correct — at least for now and to the extent it can, given ongoing transportation constraints — the Permian gas supply and demand imbalance that had emerged over the past few weeks. That said, we do expect the Permian gas market to struggle to handle ever-increasing volumes of associated gas from crude oil wells this summer and wouldn’t be surprised to see another round or two of negative prices at some point during the injection season.

Figure 1. Waha Daily Cash Prices. Source: NGI
By the beginning of fall though, Kinder Morgan’s GCX will be in operation, becoming the first of a series of proposed greenfield pipeline expansions out of the Permian to come online. (If you are looking for more specifics on the Permian gas pipeline buildout, you may want to review our Blame It On Texas series from last year. Also, see the May 13 issue of the NATGAS Permian report for our note on the Whistler Pipeline project, which is now targeting an early 2021 completion, delayed from late 2020 previously.) GCX was the first out of the blocks in the race to build a greenfield natural gas pipeline to the Texas Gulf Coast, with Kinder Morgan announcing a positive final investment decision (FID) for the project back in December 2017. Field construction on the mainline began in October of last year on the nearly 450 miles of 42-inch-diameter pipeline (dashed green line in Figure 2) that will connect the Waha Hub to the Agua Dulce Hub in South Texas. GCX also has a 50-mile lateral of 36-inch pipeline that extends into the Midland Basin. In fact, that segment has already shown some gas flowing along it, with some deliveries to Kinder Morgan’s El Paso Natural Gas (EPNG; brown line) and Berkshire Hathaway’s Northern Natural Gas (NNG; orange line) evident the last few weeks. In Kinder Morgan’s most recent guidance, all indications are that the pipeline will meet its in-service date of October of this year. That positive outlook has led to some speculation among the trader community that GCX could even be ready a few weeks earlier, a prospect that would be music to the ears of many Permian gas sellers.

Figure 2. Kinder Morgan’s GCX and PHP Pipeline Projects. Source: RBN
Regardless of whether it’s early or on time in October, GCX is set to reshape the way natural gas flows out of the Permian Basin. At this point, a quick review of the Permian gas supply-demand balance is warranted. At present, the Permian is currently producing between 9.5 and 10 Bcf/d of natural gas (dark-green line in Figure 3). Our numbers, which are taken from our weekly NATGAS Permian report, show that production breached the 10-Bcf/d level back in late March, just before the worst of the negative pricing occurred. While output has recently subsided somewhat from the March peak, it remains high enough to keep pipeline utilization out of the basin near capacity. For a quick review of the various routes out of the Permian, you may want to review our Omaha blog from last spring. In it, we detailed how the Permian takeaway pipes head in one of four general directions: south to Mexico, west to California, east to the Texas Gulf Coast, and north to the Midcontinent. Today we focus on the impending flow shifts that will primarily affect those last two corridors.

Figure 3. Permian Natural Gas Production. Source: RBN Energy
Figure 4 below shows that the pipelines moving gas east from the Permian have been running essentially full since late last year. This corridor represents the Texas intrastate pipelines that leave Waha and head east toward the Dallas and Houston markets, and includes a leg of the Kinder Morgan Texas Pipeline (blue line in Figure 2), among others. (For more detail on the Texas intrastate pipelines, see Part 2 of the “Blame It On Texas” series.) This is also the corridor that will get a major bump in capacity when GCX starts up this fall. We estimate the corridor’s existing capacity at around 3.7 Bcf/d currently (red line in Figure 4), and flows in 2019 (dark orange line) have clearly been pushing the capacity limits of the pipes moving gas east.
So, what can we expect when GCX comes online? As the big bump in the red line indicates, GCX will instantly add nearly 2 Bcf/d, boosting the eastbound corridor’s capacity to almost 5.7 Bcf/d. Based on current prices at the pipeline’s Waha source and Agua Dulce sink, we expect GCX will very likely be full very soon after it starts up, if not on Day 1, as shown by the dashed dark-orange projection line in Figure 4. That’s not to say that Permian production will spike by 2 Bcf/d at that time — we don’t expect that all of the new supply hitting the South Texas gas pipelines near Agua Dulce will be the result of new wells being brought on in the Permian. We do expect Permian gas production to grow by around 3 Bcf/d over the next year, just not all by October — not by any stretch of the imagination. What is more likely is that about 800 MMcf/d of pent-up Permian supply will likely be freed up to flow onto GCX in the pipeline’s first month of operation, which means the other 1.2 Bcf/d of capacity will be filled with Permian gas that currently is flowing to other markets. In our view, those volumes will most likely be pulled away from the Midcontinent gas market, which is currently being inundated with Permian natural gas, and redirected to GCX.

Figure 4. Actual and Projected Permian Gas Outflows East. Source: RBN Energy
The Permian’s northbound outflows to the Midcontinent (Figure 5) have been on a tear over the past two years, rising from essentially nothing to a peak of almost 2 Bcf/d this winter. That growth has been driven by price weakness in the Permian, which widened the price spread to the Midcontinent markets enough to cover the cost of transportation on the interstate pipelines that traverse this corridor. Those pipelines are shown in Figure 2 and include a leg of Kinder Morgan’s EPNG (brown system), the aforementioned NNG (again, the orange line in Figure 2), as well as the Kinder Morgan-owned Natural Gas Pipeline of America Co. (NGPL; purple line). There is also a leg of ONEOK’s WesTex (yellow line) that recently completed a 300-MMcf/d expansion to deliver volumes from the Permian into the Texas Panhandle. Volume increases on EPNG have also been fueled by the Permian North Expansion Project, which was completed in December 2018, and various open seasons offering capacity north out of the Permian.

Figure 5. Actual and Projected Permian Gas Outflows North. Source: RBN Energy
As the dashed blue line in Figure 5 indicates, we project these northbound outflows are likely to increase and fill the corridor over the summer. But, as we said above, once GCX — which is fully subscribed — comes online, it is likely to take a sizable chunk out of these flows. Our view of that decline to the Midcontinent is driven by the fact that volumes on the pipelines to the West and to Mexico are usually driven by demand in those markets. Thus, we doubt flows in those two corridors will change much when GCX starts up. That leaves the northbound flows to make up most of the 1.2 Bcf/d difference that won’t initially be provided by local Permian supply. Flows to the Midcontinent are primarily driven by economics and the need for Permian supply to price itself to find any available outlet. With GCX coming online and providing another outlet, we expect Permian prices to improve, at least temporarily, and shift those flows toward the growing demand along the Gulf Coast. More specifically, we expect Permian volumes to the north to fall below 1 Bcf/d in October and November, before recovering somewhat at the end of the year as Permian associated gas volumes continue to grow and again begin to outpace the new capacity.
So, what will that mean for the Midcontinent market? Well, it should provide some relief to the gas markets around western Oklahoma, which have been weighed down over the past few years by rising local supply from the SCOOP/STACK competing with Permian inflows to reach markets in the Midwest, where competition for market share has been intensifying due to Marcellus/Utica volumes showing up via new pipelines like Rover and NEXUS. The reduced Permian flows to the Midcontinent will also coincide with the interim in-service of Cheniere’s 1.4-Bcf/d Midship Pipeline [see Moves Like (Midship)], also due this October. Midship recently filed with the Federal Energy Regulatory Commission (FERC) to provide 1.1 Bcf/d of capacity to its shippers starting in October 2019, 925 MMcf/d of which is contracted. As a result, the Midcontinent gas market should see some significant relief later this year. How long that relief lasts will ultimately depend on how quickly Permian gas production fills the routes moving gas north before Kinder Morgan’s next pipeline — the eastbound Permian Highway Pipeline (dashed purple line in Figure 2) — starts up in the fourth quarter of 2020. In other words, while the worst of Waha pricing may soon fade away, the flow shifts and price implications driven by the flood of Permian natural gas supply may just be getting started.
ERC up 29 as strong productivity outweighs declining activity
Oil & Gas 360 has released its latest Effective Rig Count, evaluating the state of drilling activity and reported production from the major shale basins.
The Effective Rig Count rise in April, breaking a four-month slide, with an effective 29 rigs coming online in the month. The major shale basins currently have an effective 2,765 active rigs, indicating current operations are equivalent to 2,765 rigs from the January 2014 benchmark rig count.
Per-rig productivity rose in the month, while reported rig activity fell.
This is the first time increasing productivity has outweighed falling rig counts since November 2017, with productivity showing the largest increase.
https://www.oilandgas360.com/productivity-rebound-drives-higher-effective-rig-count/
A group of Republican and Democratic U.S. senators introduced legislation on Tuesday seeking sanctions targeting the Nord Stream 2, a planned gas pipeline from Russia to Germany under fire from the United States and some European Union countries.
The bill introduced by Republican Senators Ted Cruz, John Barrasso and Tom Cotton and Democrat Jeanne Shaheen, seeks to impose travel and financial sanctions on companies and individuals involved in constructing the pipeline.
The legislation reflects continued U.S. concerns over Russian influence in Europe, but the measure is many steps from becoming law. It would need to pass both the Senate and House of Representatives and be signed by President Donald Trump to go into effect.
The Nord Stream 2 project is led by the Russian state-owned gas company Gazprom, with funding from Germany’s Uniper and BASF unit Wintershall, Anglo-Dutch firm Shell, Austria’s OMV and France’s Engie.
Opponents of the 11-billion-euro ($12 billion) project worry its construction will increase European reliance on Russian energy. Trump has accused Germany of being “captive” to Moscow because of its dependence on Russian energy, and urged that the project be halted.
But gas by pipeline from Russia offers Germany, the biggest economy in Europe, and other countries in the region a cheaper option for fuel than liquefied natural gas from the United States and other producers.
Germany also wants to reduce its reliance on coal and nuclear energy.
The pipeline, which would carry gas straight to Germany under the Baltic Sea, has also been criticized because it would deprive Ukraine of lucrative gas transit fees, potentially making Kiev more vulnerable.
Washington has touted liquefied natural gas, delivered by U.S. companies, as an alternative to Russian gas.
ExxonMobil has agreed to sell down its holding in the P’nyang gas field in Papua New Guinea to Santos Ltd, giving the Australian company a stake in the field that will help feed an expansion of Exxon’s PNG LNG project.
Santos will buy a 14.3% stake from existing partners in P’nyang, including Oil Search Ltd and JX Nippon, but mostly from ExxonMobil, for a total of $187 million, Santos said in a statement on Thursday.
The deal helps smooth the way for the planned expansion of PNG LNG, roughly aligning Santos’ 13.5% stake in the LNG project and the new gas field.
“The arrangements we announce today mark an important step toward the proposed expansion at the PNG LNG plant via a 2.7 metric tonnes per annum third LNG train fed by existing Project resources and P’nyang,” said Santos’ Chief Executive Kevin Gallagher.
Oil Search said it would receive roughly $21.6 million for relinquishing a 1.65% stake in P’nyang to Santos, bringing its holding to 36.86%. Exxon will hold a similar stake in the venture after the deal, having relinquished about 12.1% of its stake to Santos.
Santos’ shares rose as much as 2% to a two-week high after the announcement, in a slightly stronger broader market.
POLITICAL RUCTIONS
The P’nyang partners are waiting to seal an agreement with the government for development of the field, but the signing has been delayed amid political ructions in Papua New Guinea.
The government of Prime Minister Peter O’Neill faces a possible vote of no-confidence later this month.
Adding to the pressure a watchdog - in findings O’Neill disputes - said the PM acted improperly when arranging for the South Pacific nation to borrow A$1.2 billion ($830 million) from Swiss bank UBS in 2014.
The Ombudsman Commission said in a December report leaked this week that O’Neill failed to follow correct legal procedures and bypassed parliament in deciding to borrow the money, used to buy shares in oil and gas producer Oil Search Ltd.
“The leak of the document is clearly political by some in the opposition playing a very dirty game in a desperate attempt to gain support for a change of government,” O’Neill said in a press release late on Wednesday.
PNG’s opposition is maneuvering to call a vote of no confidence after a string of high-profile defections from O’Neill’s government, including finance minister James Marape.
Marape told Papua New Guinea’s National newspaper on Wednesday that he quit because April’s Papua LNG gas agreement with France’s Total and its partners gave too much ground to the majors.
Norwegian oil firm Equinor has informed that oil spilled during a loading operation in the North Sea offshore Norway on Wednesday.
Equinor said that in connection with loading oil from buoy to a shuttle tanker on the Statfjord field, oil was observed on the sea surface early on Wednesday morning.
“The loading operations were stopped when this was discovered, and the loading systems were shut down. Efforts have been initiated to map the extent of the oil observed on the sea surface,” Equinor said.
“In compliance with regular procedures Equinor’s emergency response organization was quickly mobilized, and the authorities were notified,” Equinor added.
The Statfjord field has been developed with the Statfjord A, B and C production platforms, which all have concrete gravity base structures incorporating storage cells. The Statfjord A started production in 1979, Statfjord B in 1982, and finally Statfjord C in 1985.
Earlier this month, Equinor awarded a contract for the removal and disposal of Statfjord A, one of the oldest platforms on the Norwegian continental shelf.
Namely, the Statfjord A platform will shut down production in 2022, 43 years after first oil. The platform was originally scheduled to be shut down in 1999 but it has since then undergone substantial upgrading and its life has been extended several times.
The contract for the engineering work, preparations, removal, and disposal of the topside was awarded to Excalibur Marine Contractors, a company in the Allseas group. Kværner at Stord was hired by Excalibur to dismantle and recycle the topside onshore.
Offshore Energy Today Staff
Spotted a typo? Have something more to add to the story? Maybe a nice photo? Contact our editorial team via email.
Offshore Energy Today, established in 2010, is read by over 10,000 industry professionals daily. We had nearly 9 million page views in 2018, with 2.4 million new users. This makes us one of the world’s most attractive online platforms in the space of offshore oil and gas and allows our partners to get maximum exposure for their online campaigns.
If you’re interested in showcasing your company, product or technology on Offshore Energy Today contact our marketing manager Mirza Duran for advertising options.A
The price of spot liquefied natural gas contracted in Japan has continued its slide with prices declining again in April.
Data from the Japanese Ministry of Economy, Trade and Industry (METI) shows the contract-based price slipped to $5.2 per mmBtu, an 18.7 percent drop from March price.
Compared to April 2018 when the price was at $9.1 per mmBtu this represents a 42.9 percent drop.
The arrival-based prices slipped 16.9 percent from March to April. The price dropped from $7.1 per mmBtu to $5.9 per mmBtu during the month under review.
Compared to April 2018, the price declined 32 percent from $8.8 per mmBtu,
Only spot LNG cargoes are taken into account in this assessment, excluding short, medium and long-term contract cargoes, as well as those linked to a particular price index.
https://www.lngworldnews.com/japans-spot-lng-price-slides-in-april/
Gazprom's sales of Russian gas dropped 10% in the first quarter, analysis of quarterly results showed, as sales from storage dipped compared with 2018.
The Russian gas group sold a total of 59.7 Bcm to all its export markets -- both sales from storage and direct pipeline flows -- in Q1, down from 66.6 Bcm in Q1 2018.
European gas demand was impacted by mild temperatures through the first quarter, with Gazprom's head of pricing, Sergei Komlev, saying at the Flame conference in Amsterdam this week that there had been "no winter".
Lower sales from storage was the main driver behind the overall decline. Last year, sales from storage were boosted by severe cold weather across much of Europe.
Direct pipeline flows from Russia to Europe in Q1 were more or less flat year on year, according to S&P Global Platts Analytics.
Gazprom said last month it had 6.4 Bcm of working gas in storage across sites in Europe -- which include the Rehden site in Germany and Haidach in Austria as well as capacity in the Bergermeer facility in the Netherlands -- having begun the injection season with stocks of 5 Bcm.
All Gazprom data are for volumes according to Russian standard conditions (calorific value of 8,850 kcal per cu m at 20 degrees Celsius).
So, Gazprom's 59.7 Bcm, as per Russian standard conditions, equates to 54.7 Bcm in standard European measurements.
Germany, Turkey declines
Sales to Germany -- by far Gazprom's biggest export market -- fell 5.7% year on year to 15.2 Bcm in Q1 as German gas demand dropped and Norwegian supplies picked up.
There was also a major shift in Russian gas sales to Turkey, which fell to 4.5 Bcm in Q1 from 7.9 Bcm in the same period last year.
Turkey continues to try to reduce gas consumption in order to address the country's current account and trade deficits. Its gas imports fell 9% to 50.4 Bcm in 2018. Gas consumption for the year was down 8.3% to 48.91 Bcm, largely as a result of pressure on the power sector to reduce gas burn.
Turkish state gas importer Botas raised the price it charges power plant for gas by 49.5% in August, over three times the rise implemented for other consumers, with the specific aim of reducing gas burn.
Imports from Russia have been hit by a reduction in purchases by the country's private importers, which all import via contracts with Gazprom and have continued to find it difficult to sell gas into a shrinking market.
Turkey has gone from being the second-biggest supply market for Gazprom to the fourth largest, behind Germany, Italy and Belarus.
Eastern Europe
Gas sales in Poland -- eastern Europe's biggest Russian gas consumer -- also fell sharply in Q1 to 1.97 Bcm, compared with 3.22 Bcm in Q1 2018.
Poland has increased its LNG imports as it looks to diversify away from Russian pipeline imports.
Elsewhere in eastern Europe, Gazprom's gas sales in Hungary, the Czech Republic and Slovakia were higher year on year.
The increase has been attributed to a desire to increase gas storage stocks ahead of the upcoming winter on fears that gas supplies via Ukraine could be disrupted from the start of January.
Akos Kriston, deputy CEO at Hungarian state-owned storage company MFGT, said this week Hungary aimed to fill its gas storage stocks to 100% of their 6.3 Bcm capacity ahead of the "real threat" that Russian gas supply via Ukraine will be disrupted
Hungary has only filled its storage stocks to an average of around 40%-60% full over the past five years, but bookings for the upcoming winter are 100%, Kriston said.
There has been concern that if Russia's Gazprom and Ukraine's Naftogaz failed to agree a new transit deal for Russian gas to Europe before the current agreement expires at the end of 2019 that supply disruption could ensue.
The only Welsh company dedicated to collecting plastic waste from farms is suspending its services for a year.
Birch Farm Plastics said newly introduced costs at recycling plants meant it was not viable for it to continue.
It said more needed to be done to encourage recycling plants to accept more plastic from farms.
The Pontardawe company used a recycling plant which now charges fees, instead of paying for farm plastics.
Some farmers have told BBC Wales they were worried about how to dispose of their plastic.
Rules say they are allowed to store it on the farm for 12 months, but then have to dispose of it correctly.
Power outages in Iraq remain a daily occurrence for most households, as increasing generating capacity has been outrun by the increasing demand for electricity, spurred by greater cooling needs in the peak summer months. Over the past five years, the size of the gap between peak electricity demand and maximum grid supply of power has expanded, despite available supply increasing by one-third.
Alleviating the power shortages at the height of summer remains one of the most important priorities of the Iraqi government. Here, there is room for cautious optimism, as a number of options are available to help remedy the immediate shortfalls.
For example, consumers should be encouraged to shift non-essential demand away from peak hours, enabling more households to have cooling during the hottest parts of the day.
Improving networks could also provide immediate gains. This would involve identifying the weakest parts of the grid, and concentrating efforts on improving the state of the distribution network. The losses in the Iraqi system are around 40 TWh, four times the total neighbourhood generation in Iraq – addressing this could boost supply quickly.
There are also options with increase available capacity by increasing the number of small generators and larger mobile generators (both oil-based) that can be put in place quickly and can help alleviate the most intense shorages.
There are a number of pathways available for the future of electricity supply in Iraq but the most affordable, reliable and sustainable path requires cutting network losses by half at least, strengthening regional interconnections, putting captured gas to use in efficient power plants, and increasing the share of renewables in the mix. In the long term, all options are available to improve the situation in the power sector.
Where measures are taken to both curb demand and increase available capacity, Iraq could establish a capacity margin by 2030 (where available capacity exceeds peak demand). At that point, grid supply would be available to most consumers 24 hours per day.
Livent Corp said on Friday that two senior executives were leaving to pursue other opportunities, coming just days after the lithium producer cut its 2019 forecast and warned that demand was slipping for a version of the white metal it produces.
Philadelphia-based Livent said Chief Growth Officer Thomas Schneberger would leave at the end of the month and that Rasmus Gerdeman, head of strategy and investor relations, has already left.
Lithium is a key material used to make electric vehicle batteries. Livent has focused its business on one specific type of the white metal, hydroxide, which has seen weak demand in recent months due in part to uncertainty around China’s electric vehicle subsidies.
Livent on Tuesday cut its full-year profit and revenue forecasts, citing weakening prices for hydroxide and lower demand from some customers. The company’s stock has dropped 27 percent since the forecast cut, closing Friday at $8.06 per share.
Livent rival Albemarle Corp has split its business focus between hydroxide and carbonate, another type of lithium, helping to inoculate it from market gyrations. Albemarle posted a better-than-expected quarterly profit on Wednesday and reiterated its full-year forecast.
Schneberger joined chemical maker FMC Corp in 2007 and moved to Livent when it was spun off from FMC last year. He was responsible for overseeing operations, sales and marketing, and for 2018 was given a higher-than-expected bonus due to his performance, according to regulatory filings.
As the third-highest ranking executive at the company, Schneberger is eligible for a one-time severance payout equal to his base salary and annual bonus, an amount that would exceed $620,000 at 2018 levels, according to the filings.
Gerdeman joined Livent in 2018 roughly five months before it was spun off from FMC. He previously worked for consultancy FTI Consulting Inc.
Gerdeman was responsible for long-term operational planning and identifying potential acquisition targets. Livent said earlier this year it was looking to buy another lithium mine; the company’s only existing mine for the white metal is in Argentina.
Both Schneberger and Gerdeman reported directly to Chief Executive Paul Graves. Neither Schneberger not Gerdeman responded to requests for comment.
Livent said Daniel Rosen, the current investor relations manager, will assume Gerdeman’s responsibilities.
A new energy storage system will be built to offer multiple grid services such as voltage compensation, reactive power, frequency regulation services and renewable base load in South Australia.
Renewable energy firm Pangea Energy has signed an agreement with Celltube to build a 50MW / 200MWh energy storage system on grid scale level in Port Augusta.
The $200 million energy storage system will be integrated with a planned 50MW solar project at the same site.
Constructions will start in late 2019 with plans to be operational in 2020.
Pangea Energy will own and operate the site.
Due to instability of the grid network, Australia has committed to expanding its portfolio of grid-scale energy storage systems to complement its growing renewable energy mix.
The region has deployed a number of lithium-ion-based storage systems under pilots and is moving to long duration storage systems as base technology.
Stefan Schauss, CEO of CellCube, said: "The Pangea Storage Project is a wonderful example on how renewable power generation and a safe, reliable and sustainable energy storage technology such as the Vanadium Redox-Flow battery are a perfect symbiosis to provide renewable base load today.
The technology being tested "… is three times more efficient than any Power-2-X or Hydrogen technology which will not be available at this scale in the next 3 years…”
The technology has a lifetime of 25 years with no degradation or augmentation like needed for lithium, according to CellCube.
Luis Chiang Lin, CEO of Pangea added: "Australia has massive Vanadium resources and the exploration of vanadium is pretty simple, cheap and does not have the impact on nature and labor conditions such as cobalt or other rare earths in the lithium industry. As such, choosing Vanadium and working with CellCube as market leader in the vanadium related storage industry is a perfect match for our project."
The United States has again decided not to impose tariffs on rare earths and other critical minerals from China, underscoring its reliance on the Asian nation for a group of materials used in everything from consumer electronics to military equipment.
The minerals are set to be among the few items spared from U.S. tariffs in an escalating trade war with China, which is by far the world’s biggest producer of rare earths.
Beijing, however, is set to raise tariffs on around $60 billion in U.S. goods, including rare earth ores, hitting back at a tariff hike by Washington on $200 billion of Chinese goods in the bitter trade dispute.
The office of U.S. Trade Representative Robert Lighthizer also on Monday released a list of further Chinese goods, worth around $300 billion annually, that have been earmarked for a 25 percent tariff. Lighthizer on Friday said this next round of tariffs would cover “essentially all remaining imports from China” not yet hit by tariffs.
The list, which is open for public comments until June 17, does not include rare earth materials and other critical minerals, and also excludes pharmaceuticals and select medical goods, the document said.
“These materials are critical to U.S. industry and defence, and with nowhere else to turn for supplies in the near-term, the tariffs would invoke more suffering on U.S. end-users than China,” said Ryan Castilloux, managing director of consultancy Adamas Intelligence, in an e-mail.
In July last year, the U.S. Trade Representative office included rare earths on a provisional list of tariffs on Chinese goods, only to remove it later from the final list.
The United States “won’t be unable to find a replacement in the short term ... so if they want to tax rare earth products that would make it worse for themselves,” said an analyst at stake-backed Chinese research house Antaike, who asked not to be named.
Rare earths were in a list of 35 minerals deemed critical to U.S. security and economic prosperity published one year ago. Most of these 35 minerals are now subject to the U.S. tariffs on Chinese goods, but rare earths, antimony - used in batteries and flame retardant - helium and natural graphite are not.
Cesium and rubidium, used in research and development and neither of which are mined in the United States, are also spared, as are fluorspar, used to make gasoline, steel and uranium fuel.
Beijing said on Monday it would raise tariffs on U.S. rare earth metal ores from 10 percent to 25 percent from June 1, making it less economical to process the material in China.
The 10 percent tariff still left a profit for the processors, but the higher 25 percent rate will be “quite hard to bear,” the Antaike analyst said.
Germany's latest onshore wind auction was again undersubscribed with just 270 MW of a potential 650 MW awarded, grid regulator BNetzA said Monday.
This is the third undersubscribed onshore wind auction as new project permits slow to a trickle in 2019 after 20 GW were added over the previous four years.
The regulator warned of a "new worrying dimension" to the low level of competition in the auctions, due it said to the "difficult situation for permits for new onshore wind turbines by the regional authorities." At Eur61.30/MWh, average sliding premium prices awarded in the auction were little changed from the previous round, and just below the Eur62/MWh bid ceiling.
In 2018, 2.3 GW of onshore wind capacity was awarded at an average Eur56/MWh.
Just 191 MW of new German onshore wind capacity was added in Q1 2019, the "worst quarter this millennium" for the technology, according to consultancy FA Wind.
Legal action continues to delay projects with at least 750 MW stuck in the courts, the consultancy said.
However new permits were up 33% on year at 413 MW in Q1, it said.
The next tender for onshore wind is scheduled for August with the government planning to auction a 3.7 GW across six auctions this year.
Total installed wind capacity in Germany is approaching 60 GW with 6.4 GW offshore.
Wind output set a new record in Q1 averaging almost 20 GW putting wind on track to become the biggest source of German electricity for the first time this year.
There has been a huge amount of interest in the new assessment of marginal loss factors – both in the final decision made by the Australian Energy Market Operator that we reported on Monday, and in the fascinating animated gif that highlighted the changes across the country in the last decade.
MLFs may be based around obscure algorithms but they are critically important. A big downgrade – as some wind and solar farms have discovered – means a lot less revenue, and some projects now may only get credit for 75 per cent of their output.
To throw yet more light on what’s going on, here’s another illustrative graph by the same people who brought us the animated gif, the project management firm Ekistica.
It shows the changes in MLFs over the past decade by technology, and it shows one clear trend – the gradual spike upwards in MLFs for the solar industry and the sharp plunge in the last two years for the same technology.
It’s pretty clear what has happened here. At first solar farms were installed in areas sparsely populated with generators, filling in the gaps and benefiting with high MLFs of above 1.0 (meaning they got a premium rather than a discount).
But then too many solar farms were built in the same areas, causing congestion on the grid. The average MLF for solar farms is now just above 0.9, meaning that nearly 10 per cent of their output is not credited.
As Ekistica’s Lyndon Frearson notes, so many solar projects located themselves at points of high MLF that they have effectively eaten their own lunch, and cannibalised their market.
Or, as AEMO noted in its final assessment of MLFs: “With increased generation connections of the same technology in an area, a daily pattern is observed due to increased supply and low demand during daylight hours. As a result, MLFs in these areas are declining sharply.”
AEMO provided this graph above as an example.
The trend for other generation technologies (see the top graph) is pretty consistent, probably because they were either closer to load or had more geographic or production diversity. The MLFs of all three other technologies – fossil fuel, wind and hydro – have also fallen in the last year, but more gradually than solar.
The MLF factor is probably the major blight on the copy-book of the solar boom, which is rapidly changing the shape of the Australia grid, as we reported here in some detail.

Large scale solar is now contributing more than five per cent of the main grid’s operational demand, and this graph above highlights how this share has grown significantly over the last 12 months – the difference between the red and dark lines – and will grow further as yet more projects (more than 3,000MW) are added to the grid in the coming 12 months.
The greatest share of large scale solar occurs in South Australia (on average more than 8 per ent of operational demand at midday) and this will grow as more solar farms are included (the newly complete 95MW Tailem Bend and the yet to be complete 110MW Bungala 2), among others such as the 280MW Cultana plant.
Interestingly, the graph above shows a flatter profile for Victoria, which AEMO attributes to the greater share of single axis tracking technology in that state.
There is plenty of criticism about the way MLFs are structured in Australia and the rules that apply. AEMO itself admits that there must be a better solution and it is working to find one to provide clarity and certainty to developers of wind and solar projects.
Mostly, it wants to be able to get on with its Integrated System Plan, which it says provides a blueprint for the transition of the grid to a renewables dominated system, and will unlock some of the current blockages.
AEMO is updating that ISP, and was due to outline the various scenarios it would incorporate in its planning – including, at the urging of many of the big utilities and lobby groups, a “step change” scenario that factors in early closures of remaining coal plants, a more rapid uptake of wind and solar, and a serious assessment of what is needed to meet Paris target’s 1.5°C target.
That scenario planning was due to be released this week. However, perhaps given the sensitivity of the issue and the election on Saturday, a spokesman for AEMO said no announcements would be made this week.
https://reneweconomy.com.au/how-the-big-solar-boom-saw-major-pv-projects-eat-their-own-market-57079/
Prices of medium-to-heavy rare earth, such as dysprosium oxide and terbium oxide, extended their increases this week as imports of rare earth ore from Myanmar through Yunnan Tengchong Customs were again halted on Tuesday May 14.
The prohibition followed after the Tengchong Customs in November of last year restricted imports of commodities from Myanmar. The customs acts as the sole entry point from Myanmar into China. It remains unclear when the ban should be lifted.
As of Thursday May 16, prices of dysprosium oxide climbed to 1.6-1.62 million yuan/mt, from 1.48-1.49 million yuan/mt on Tuesday May 7, SMM assessed. Prices of terbium oxide rose from 3.14-3.17 million yuan/mt on May 7, to 3.3-3.35 million yuan/mt as of May 16.
Market participants expected further upside room in prices of dysprosium, terbium oxides in the weeks ahead. This prevented sellers from letting go cargoes, SMM learned. Higher offers sidelined downstream buyers, and drove them to seek alternatives to dysprosium, terbium oxides.
Customs data showed that China imported some 25,829 mt ion-absorbed rare earth ore, which is rich in medium and heavy rare earth elements, from Myanmar in 2018.
Domestic imports of mixed rare earth carbonate in January were below half of the imports in January 2018. A decline of 67% in the imports of Myanmar’s products accounted for the loss.
It is not relying too heavily on journalistic tropes to say that sunny days are not the first thought that come to mind when we think of the United Kingdom, but according to the country’s solar power trade group, the peak solar generation record was broken twice over the first two days of this week.
The UK’s Solar Trade Association announced twice this week that the country’s all-time solar generation peak record was broken, first on May 13 around noon when solar hit a generation peak of 9.47 GW – which surpassed the record previously set in May 2017 of 9.38 GW – then again a day later on May 14 when generation peaked at 9.55 GW at around 12:30pm.
“It is impossible to argue with the numbers,” crowed STA Director of Advocacy and New Markets Léonie Greene. “The bright clear skies combined with mild temperatures means solar has consistently met big portions of electricity demand throughout recent days.
“Days like these show that the technology can deliver clean, affordable power in abundance. We now need Government to provide a level playing field with other technologies and allow solar to thrive without public support. Currently solar in the UK faces a plethora of barriers which have dramatically slowed deployment.
“The sobering reports out recently from the International Energy Agency and the International Monetary Fund show fossil fuels subsidies are rising globally as renewables investment stagnates. Every country now needs to buck that trend and particularly the UK given we still lag behind the EU average for renewable energy.”
The stereotype of British weather is not the only factor contributing to the lack of attention on the country’s solar industry. As STA’s Léonie Greene suggested, the UK Government must now allow the numbers to speak for themselves and stop hindering the industry’s role in the country’s energy mix.
Specifically, as the STA highlights, there are a number of challenges facing the UK’s solar industry. Prime among them are “challenging policy and regulatory issues” such as a proposed change to the way the already reduced-rate value added tax (VAT) is applied to solar as an energy saving technology, and a lack of “clear and fair remuneration” for small-scale and residential solar to export power to the country’s grid.
Further, solar is consistently excluded from involvement in the Government’s Contracts for Difference (CfD) scheme for providing new capacity – relegated with onshore wind as the only two renewable technologies unable to participate.
In addition, the STA points to “unfair business rates for organisations that install solar on their buildings and a glut of unhelpful charging regulation reforms proposed by Ofgem” as further impediments to the way solar can participate in the energy mix.
Currently, solar only provides around 4% of the UK’s electricity. It is nevertheless one of the UK’s most popular sources of electricity, with 80% of community energy schemes featuring solar power and with solar on over 975,000 homes.
In the Government’s own Public Attitudes Tracker, solar consistently scores well over 80% in terms of its communal popularity and reached a record 89% in the latest Tracker.
These new record peak generation records may not play a huge part in the way solar is viewed moving forward, but it is more fuel to the argument that the UK Government must quickly allow solar the same support and lack of impediments granted to other renewable energy technologies.
TEHRAN, May 11 (MNA) – Minister of Agriculture Mahmoud Hojjati revealed the provision of food security in sanctions period.
He made the remarks on Saturday in his meeting with deputies and executives of the ministry and emphasized on full provision of food security of the country in sanction s period.
Considering the current situation and restrictions imposed by the US government on Iran in trade, business and oil fields, financial and scientific exchanges, new approaches and strategies should be taken in line with preserving and promoting production and supply of food needed in the country, Hojjati reiterated.
He also placed his special emphasis on the need to ramp up research and scientific activities for meeting food requirements in the country and reducing dependency in accordance with the current situation and macro strategies of the country especially in livestock and poultry industries.
Turning to the problems caused by sanctions and stonewalling of enemies on the country, he stated, “Iran enjoys high potentials and capacities that can meet requirements of agricultural sector optimally.”
He called on research activists of the country to cooperate with international centers and urged researchers in agricultural sector of the country to establish fair interaction with foreign research centers and agricultural experts of other countries in line with meeting demands in this field.
He also urged private sector to play a leading role in this respect and acknowledged, “most research activities in the world are conducted by the private sector, so that private sector should help public sector materialize most objectives in relevant field.”
Mehrnews
A jury Monday awarded $2.055 billion to a California couple who blamed Bayer’s Roundup weedkiller for causing their cancer, the largest such verdict to date and one that adds significant pressure to a company struggling to contain the fallout from last year’s acquisition of Monsanto Co.
The verdict by the Northern California jury is the third straight trial loss for Bayer over the safety of Roundup. Bayer is facing a revolt from shareholders over the Monsanto deal, which exposed Bayer to some 13,400 claims tying Roundup to cancer.
https://www.wsj.com/articles/in-latest-roundup-herbicide-defeat-for-bayer-jury-awards-california-couple-2-billion-11557782148
Two previous trial losses have helped wipe more than 30% off Bayer’s share price. Last month, a majority of Bayer shareholders refused to endorse management’s actions in the past year, indicating that investors lack confidence in how the company is being run.
It’s the largest jury award in the U.S. so far this year and the eighth-largest ever in a product-defect claim, according to data compiled by Bloomberg. Bayer has now lost three trials in a row over claims Roundup causes cancer.
A jury in state court in Oakland, California, issued the verdict Monday after two other California trials over the herbicide yielded combined damages of $159 million against the company. Bayer is appealing those verdicts and vowed to challenge Monday’s as well.
The jury’s decision “conflicts directly with the U.S. Environmental Protection Agency’s interim registration review decision released just last month, the consensus among leading health regulators worldwide that glyphosate-based products can be used safely and that glyphosate is not carcinogenic,” Bayer said in a statement.
The jurors agreed that Alva and Alberta Pilliod’s exposure to Roundup used for residential landscaping was a “substantial factor” in their non-Hodgkin’s lymphoma. The jury awarded damages of about $55 million for the couple’s medical bills and pain and suffering on top of the punitive damages.
The verdict will be vulnerable to a legal challenge by Bayer because courts have generally held that punitive damages shouldn’t be more than 10 times higher than compensatory damages.
Monsanto Co., the maker of Roundup acquired by Bayer last June, is the named defendant in similar U.S. lawsuits filed by at least 13,400 plaintiffs.
“The verdict in this trial has no impact on future cases and trials, as each one has its own factual and legal circumstances,” Bayer said in its statement.
While it was a “risky move” to ask for an award of more than $1 billion, the three verdicts against Bayer show jurors are convinced by evidence against the company, said Anna Pavlik, senior counsel for special situations at United First Partners LLC in New York.
“In this case there appeared to be more detailed evidence damaging to Monsanto, which strengthens plaintiffs’ cases down the pipeline even further,” said Pavlik, who has followed the trials.
https://www.agweb.com/article/bayer-jury-awards-2-billion-damages-in-third-roundup-trial/
BHP on Tuesday admitted to institutional investors it “overinvested” in its Jansen potash project in Saskatchewan where the Anglo-Australian giant has already spent $2.7B over nearly six years.
At a BofA Merrill Lynch mining and metals conference held in Barcelona, CEO Andrew Mackenzie said the company’s “thinking around the project’s initial scope has evolved”:
“However, Jansen remains an attractive option for BHP given its strategic fit, risk-return metrics and the longer-term optionality the initial investment would create.”
Two shafts have been sunk at Jansen, but BHP will have to invest another $5.3–$5.7B to finish phase one construction of the mine which the company said would take fewer than 5 years to complete. BHP has in the past said it would consider selling a stake in Jansen to share capital and risk.
BHP says it can produce potash for around $100 a tonne at the mine. Prices for the crop nutrient at the Vancouver port have improved to $265 a tonne from $215 a year ago. That compares to around $400 a tonne when Jansen was first conceived and record highs more than a decade ago of $870 per tonne.
The deposit can accommodate another three phases – at $4B per phase – that would lift annual capacity to more than 16m tonnes per year, vastly improving the economics of the project.
BHP has long been eager to enter the potash market in Saskatchewan, diversifying its asset base now concentrated around iron ore and copper since disposing of its US oil assets a year ago.
In 2010, Canada blocked BHP's $40 billion hostile takeover bid for Potash Corp (now Nutrien after merger with Agrium) arguing the company's mines are strategic national assets.
http://www.mining.com/bhp-says-jansen-potash-mine-remains-attractive-option/

Janus Dongye, Interested in Chinese history and geography
Seeing is believing. Open your Google Earth and have a look at what is really going on in China from above. Western media won’t normally tell you about this.
I will guide you through and point you where to look at.
Here are the coordinates:
Location 1: Ningde Bay, Fujian, China (26°43'02.8"N 119°57'45.2"E)
Our first destination is the coastal area in Fujian province.
If we zoom in, we can find millions of floating houses and cages on the sea surface.
If you look around the coastline from Zhejiang province to Guangdong province along the 1000 miles, you can see those floating cages are virtually “everywhere”.
What are those? They are actually Chinese “seafood farms”.
Instead of going out to the oceans and catching wild seafood, why not stay in the same place and raise your own seafood? And you can actually make more money with much less effort from raising fish, shrimps, crabs, lobsters, clams, etc.
It is not just sea or ocean waters that are being farmed, Chinese farmers find any possible open water such as reservoirs, rivers, lakes for farming their seafood/freshwater food.
Imagine each of the cages contains tens of fishes and crabs. That’s A LOT of FISH!
So how much seafood does China consume?
It is estimated that the global demand for seafood consumption is 143.8 million tonnes per year and China alone has the largest seafood consumption (65 million tonnes, 45% of global consumption), followed by the European Union (13 million tonnes), Japan (7.4 million tonnes), the United States (7.1 million tonnes) and India (4.8 million tonnes). (Source: EU SCIENCE HUB)
As we know, both China and India have a similar population but China consumes 12 times more seafood than India, despite the fact that India is in a better geographical position surrounded by warmer oceans in a tropical fishing-rich region.
Among the 65 million tonnes of seafood consumed in China, only 15 million tonnes are caught from the wild, the rest of 50 million tonnes are all raised by aquaculture “farming”. In contrast, 90% of Japanese seafood consumption is from wild catch. Thanks to seafood farming, normal Chinese families can afford cheap seafood in their daily meal. This is a typical family get-together dinner settings: You can see lots of them are seafood!
This vlog shows how a bigger Chinese family enjoys steamed seafood. The whole table only costs around $120 US dollars.
Location 2: Nanxun, Huzhou, Zhejiang, China (30°46'14.5"N 120°09'02.9"E)
Our next destination is the vast flood plain of between the Yangtze River, Taihu Lake, and Qiantang River. Thanks to the abundance of fresh water carrying nutrients from the river upstream, this area is so productive that it has raised over 100 million people here. And it is one of the most densely populated areas of China. This area is very similar to the flood plains in Bangladesh, West Bengal in India, Saigon in Vietnam etc.
What have the Chinese done differently compared to other densely populated flooded plains in India and Bangladesh?
Instead of growing rice, the Chinese have been growing a variety of “water food” that can sell at higher prices and makes them become richer than if they were growing rice. If you zoom in, you will find millions of fish ponds instead of rice fields. Besides the fish ponds, you might identify lots of green trees grown around them.
These trees are mulberry trees used for silkworm farming. Over the past two thousand years, the Chinese have developed many sophisticated and sustainable agriculture ecosystems around these areas. One most famous eco-cycle is the fish-mulberry tree-silk cycle as shown in the following graph:
Chinese farmers have been exploiting the ecosystem in fish, silk farming for thousands of years without knowing the concept of “sustainable development”. Nowadays, it is evolved into multiple cycles of “recycling” on the same land:
However, in order to raise more fish in the ponds, you need an aerator that pumps air into the water, otherwise, the fishes would not have enough oxygen to breathe. In the following picture, the aerator is the white dot in the centre of each pond.
Having an aerator requires every fish pond to be connected to electricity. How to generate electricity for the aerators? Yes, you are right: have solar panels.
From Google Earth, you can see that solar panel fish ponds are already taking over some of the traditional mulberry fish ponds in China. Some of the areas in Huzhou area have already installed solar panels.
Above picture: The left is the traditional mulberry fish ponds. The right is the latest solar power fish ponds.
Local fishermen and farmers are actually forced to learn the latest solar technology and sustainable techniques provided by professionals from the local Chinese government.
Why are the local Chinese governments so eager to promote high tech to the local farmers? In order for an official to gain promotion to the next rank, he or she has to demonstrate their “government performance”. Solar panel fish ponds is one of the best indicators for “promotion” as it fits well in the sustainable development initiative.
From this, you might understand why China has dominated the world’s silk production (84%), and freshwater fish production (66%) and solar energy generation (25.8%). In the Zhejiang, Jiangsu area, rural people eat fish almost every day. Some say that’s why people from these regions are more clever than other regions of China.
Eco-cycle option 2: lotus root - fish
In some fish ponds, you can also grow other kinds of vegetables while raising fish. One of the most widely grown vegetables is the lotus root. China lotus root production is 11 million tonnes which accounts for 90% of world production and 60% of the world export. Not only Chinese people like to eat them, but most of the lotus root production is exported to Korea, Japan, and Vietnam.
Lotus roots are one of my favourite vegetables too, I hope China can promote this delicious root for the rest of the world to enjoy as well.
Eco-cycle option 3: canola oil - bee- fish & crab
You can also grow rapeseed using the same principle. Instead of using fertilizers, at each winter, Chinese farmers dig the “nutrient mud” from the bottom of the water and stack on the bank. And then they grow different plants such as rapeseeds or taros on the mud. After thousands of years of continuous cultivation, the field has become something like this:
Location: Duotian(垛田镇), Xinghua, Jiangsu, China 32°56'51.9"N 119°51'50.4"E
There are no roads. You can only navigate around using boats. Of course, that is why China is also the leading world producer of rapeseed oil (22% of global production).
Not to mention the massive beekeeping industry that thrived on the rape flowers in China, China takes over 30% of the global honey production.
Bayer's Monsanto May Lack Insurance for Roundup Punitive Damages
2019-05-17 07:00:12.510 GMT
BI BITID=<1038790_V57.0>=
Bayer's Monsanto subsidiary faces 13,400 lawsuits over claims Roundup causes cancer and insurance likely won't cover punitive damages awarded. While the verdicts likely get reduced, efforts to completely overturn them will be an uphill climb. Bayer's total liability could be limited to Monsanto's assets, which Bayer acquired for about $66 billion in 2018.
|
-0- May/17/2019 07:00 GMT
Dhano happy with agriculture irrigation project
Agricultural Society president Dhano Sookoo looks at the irrigation project at the Orange Grove Estate last week. PHOTO BY KERWIN PIERRE
PRESIDENT of the Agricultural Society (ASTT), Dhano Sookoo, says a flood mitigation and irrigation project on state lands at the Orange Grove Estate, Tacarigua, which is being funded by its farmers, may prevent an increase in food prices and unemployment, as well as further foreign exchange woes.
"This is what you call direct intervention," said Sookoo, during a tour last week of the estate where work continued on a project to combat the harsh dry season conditions.
Sookoo hopes the first part of the dredging project will be completed before the rainy season begins.
She said it would have finished weeks ago if all arms of the government were on the same page as the society.
"If this project was not ongoing, you would have had serious fallout with labour in this country. We would have contributed to unemployment in this country. We would have been contributing to higher food prices in this country."
The project includes the clearing of channels to open reservoirs, which will capture water entering from outside sources, such as drains.
"The water is natural spring water coming from the ground."
She credited the Ministry of Works and Transport for supplying heavy machinery for dredging, but expressed dissatisfaction with the Ministry of Agriculture and the Office of Disaster Preparedness and Management because of its apparent disinterest in a project which directly concerns them.
The farmers, she said, were paying operators' salaries, as well as the maintenance and purchasing of fuel for equipment.
"This is where you, as taxpayers, as citizens, are supposed to feel the impact of your taxpaying dollars. These are state lands, almost 3,000 acres of state agriculture lands, and if we did not do what we are doing now, in collaboration with the Ministry of Works, you would have find almost 75 per cent of these lands idle.
Sookoo said there are government agencies and ministries with adequate machinery sitting idle.
"At the ministry (of works), even where they have a few operators, they do not have fuel for the equipment. So the taxpayers, we are paying salaries to these people and no work is being done."
ASTT director and the project's manager Ronald Chan added: "So far (with limited equipment) we've been able to work on 250 acres. So compare that to 3,000 acres and you'll get an idea of the resources needed to complete the project."
He said the equipment on hand provided for only one-third of machinery required for the task.
They, however, pointed to a high-yield lot of dasheen bush for export as an example of an important crop saved by the irrigation project.
Had the crops not been salvaged, one director noted, it could have resulted in foreign purchasers seeking alternative suppliers and a loss of much needed foreign exchange.
Sookoo said the Ministry of Agriculture should have been more involved in the initiative as it would reduce or even prevent claims for losses from flooding.
“We will no longer have that (large-scale crop losses), once we do what needs to be done in an efficient way. At this time – for us to get the job done the way it should be done – we require much more resources, in terms of equipment.”
A surge in investment demand has slashed expectations of a large surplus this year in the global platinum market, the World Platinum Investment Council (WPIC) said on Monday.
In March, a report by the WPIC forecast global oversupply of 680,000 ounces of platinum this year, its largest oversupply since at least 2013.
But the industry group, which uses data from an independent consultancy, said in its latest report that the 2019 surplus wasmnow forecast at 375,000 ounces.
A jump in demand by institutional investors for platinum ETFs (exchange traded funds) in the first quarter has dramatically changed the outlook, said Trevor Raymond, director of research at the WPIC.
Holdings of physically-backed ETFs climbed by 690,000 ounces in the first three months of this year, the strongest rise since the ETFs were launched in 2007.
"Investors have been telling us that they would need to see a combination of factors before they could comfortably act," he said in an interview.
"In the first quarter we had the combination of rising prices, a downside supply risk in South Africa and there wereseveral demand growth signals, the two most important being more
diesel cars on the road and the potential for platinum to be used in gasoline vehicles."
While the spot platinum price has shed more than 40 percent over the past five years, it has rebounded by nearly 10 percent so far this year.
It appeared that ETF buyers were long-term investors such as pension funds, encouraged by stabilisation in the diesel market, Raymond added.
While appetite for platinum had soured since Volkswagen's "dieselgate" scandal in 2015, the proportion of diesel cars in the key West European auto market has crept up in recent months
after touching a low around 32% late last year, down from about 50% in its prime, Raymond said.
Emissions-reducing catalytic converters in diesel vehicles contain more platinum, while sister metal palladium is a larger component in gasoline engines.
Total platinum demand in 2019 is expected to rise by 8% while supply is due to increase by 4%, the report said.
The first quarter saw a 19% jump in mining supply, mainly due to the release of metal locked up by smelter repairs and maintenance in 2018.
But that is not expected to be repeated next year. "Consequently, we expect 2020 refined production to be significantly below the 2019 level," the report said.
A community meeting in Middlemarch on Saturday discusses a proposed diatomite mine and a lack of information to date. PHOTO: LINDA ROBERTSON
A Community meeting in Middlemarch is still searching for answers to questions about a proposed multimillion-dollar diatomite mine in the area, a year after the issue was to have been aired in public.
Australian company Plaman Resources, which has a majority Malaysian backer in Iris Corporation, wants to mine up to 500,000 tonnes of diatomite as an animal feed supplement - as opposed to its more common use as fertiliser - for export.
While the operation could generate more than 100 jobs, there are questions over mining, 24/7 truck fleet operations, roading issues and the value of the site being recognised as a vast fossil depository.
About a year ago mine owner Plaman Resources told the ODT it would be holding a public meeting in Middlemarch, but instead it is still awaiting the outcome of an application to the Overseas Investment Office to buy a farm next to the mine.
Plaman's proposed diatomite mine is in Moonlight Rd near Middlemarch, which was many years ago subdivided off the still existing Foulden Hill farm - the property Plaman wants to buy.
The meeting was called by local residents Patricia and Kobi Bosshard and attracted about 30 people to the local hall.
Andrea Bosshard and Shane Loader described themselves as "new residents" but with regional family ties.
The "catalyst" for the meeting was the leaking and subsequent publication three weeks ago by the ODT of a "private and confidential" report by investment bankers Goldman Sachs outlining how $470million was required to get the proposed mine to full production, Ms Bosshard said.
"There's some irony in finding out what's going on in our backyard through a randomly leaked Goldman Sachs report to the ODT," she said.
"Most people had forgotten about it, from a year ago, having heard nothing," she said.
"The [meeting's] purpose was not pro-mining or anti-mining, but to look beyond the conjecture, hearsay and rumours," Ms Bosshard.
However, she said while no vote was taken, the general consensus of the meeting was not for mining development, but instead the foundation of a "geo-park", as had happened after the discovery of similar diatomite fossil sites in Germany, Norway and China.
The Foulden Hill Maar (a volcanic crater lake) is rich in fossils and considered a pre-eminent site by geologists and academics.
"The natural heritage should be first and foremost of any development," Middlemarch resident Shane Loader said of sentiment at the meeting.
While Plaman was not invited to the meeting, he said the company had had "plenty of opportunity" to engage with the community, further claiming "promises had been made to certain people ... talking to people behind closed doors" in the area.
The pair said another meeting would be held next month, in which the group would look at becoming formally "organised".
Plaman's diatomite project is still scheduled for an update at the forthcoming Minerals Forum 2019, later this month in Dunedin.
Profit for the 2019 period was $528 million, compared with $244 million reported in the first quarter of 2018, with basic earnings per share at $4.02, compared to $1.87 a year ago.
The adjusted net profit for the quarter was $243 million, 9% higher on the year, while profit margin slipped four percentage points to 32%.
Adjusted EBITDA rose 26% to $488 million, with the margin up two percentage points to 65%.
Polyus said its total revenue for the quarter climbed 22% on the year to $751 million, while its operating profit also rose 19% to $396 million.
Capital expenditure over the January-March period dropped 46% year-on-year to $99 million, while net cash flow from operations climbed 68% to $438 million.
In early May the Polyus board approved the dividend for the second half of 2018 of $2.22 per ordinary share, amounting to $296 million. This brings the total dividend payout for 2018 to $560 million.
As previously reported, quarterly gold production rose 19% on the year to 601,000 ounces at an all-in sustaining cost of $589 per ounce, down 11% due to a strong cost performance at Natalka and the company's ongoing focus on implementation of cost-containment initiatives.
Gold sales for the quarter were also up 24% to 570,000oz, with the average realised refined gold price down 2% at $1308/oz.
Polyus had cash and cash equivalents of $1.6 billion at the end of March, 43% higher than a year ago and up 74% from the end of December.
It also reduced net debt by 2% year-on-year and quarter-on-quarter to $3 billion.
CEO Pavel Grachev said the quarter had been characterised by solid operational and financial performance.
"We remain safely on track to meet our production guidance. Polyus anticipates its full year production to be approximately 2.8 million ounces of gold in 2019," he said.
Polyus' shares (LSE:PLZL) were trading at $38.40/share Tuesday, up from $38.40 at the start of the year, but down from the year-to-date low of $42.58 on March 18.
Scientists have branded plans for octopus farms 'ethically unjustifiable' and have called on companies to block funding for the new factories.
The team of researchers have responded to news that some seafood companies hope to be shipping mass-produced octopus to restaurants by 2020.
They say the plans could be fatal for the 'highly intelligent' creatures and will put yet more pressure on the ocean's livestock.
Scientists have warned plans for octopus farms are 'ethically unjustifiable'
The leader of the group Professor Jennifer Jacquet of New York University, says that octopus farming is 'ethically and ecologically unjustified.'
She says many of the octopuses could die from stress.
Professor Jacquet told the Observer: 'We can see no reason why, in the 21st century, a sophisticated, complex animal should become the source of mass-produced food.'
'Octopuses eat fish and shellfish, and supplying enough to feed large numbers of them puts further pressure on the food chain. It is unsustainable.'
Seafood company Nissui hope to be shipping farmed octopus to restaurants by 2020
To feed the octopuses, the companies will need to catch huge quantities of fish, which will further threaten marine livestock.
The international group have called on private companies, academic institutions and governments to block funding for the factories.
There are more than 300 species of octopus around the world and 350,000 tonnes of the seafood are already caught and served in restaurants every year.
Scientists say octopuses are 'highly intelligent' and have been known to use tools and even navigate simple mazes and protect the entrance to their dens.
In one experiment, the cephalopod had managed to build a shelter from coconut shells.
In June 2017, Japanese seafood company Nissui announced they had successfully hatched eggs of fully-farmed octopus using artificial incubation.
In the past, farming octopuses has been hindered because they only eat live food, making it expensive.
But it was discovered the younger creatures are less fussy eaters, making them an easy and cheap breeding stock.
Nissui is not alone, with companies in Mexico and Australia also announcing plans for mass-produced octopus in the near future.
The plans are only in the development stage but researchers hope to halt any proposals to fund the farms.
They say that octopus is a delicacy and should be not be the subject of intensive mass production.
China's aluminium scrap importers have been allowed to file applications to local solid wate control authorities for import license for the second half of the year, but they are likely to face smaller volumes of imports approved, a source told SMM on Thursday May 9.
Qualified companies can receive the import license before July 1. SMM also learned that the number of approval batches for aluminium scrap imports will decrease from that in the first half of the year.
While some companies have received the green light, approved volumes have not been released as of Thursday May 9.
China Customs data showed that domestic imports of aluminium scrap in March shrank 40.5% on the year to stand at 126,000 mt.
Imports in the first three months came in at 332,000 mt, down 31.7% from the same period a year ago.
By Wood Mackenzie Senior Consultant, Yanting Zhou
"Previous experience shows the escalation of trade tensions always has a negative impact on the copper price, as the market believes that increased tariffs will have a negative impact on global economic activity and, therefore, on copper demand. A trade war between the two largest economies also raises the spectre of a global recession. However, after the announcement today, the copper price actually ticked higher on both the SHFE and LME exchanges. It is believed that some money from the Chinese government has gone into the Chinese stock market to support market sentiment.
"We estimate that China's indirect copper exports to the U.S. accounts for 3% of Chinese total copper consumption per year. The list of $200bn worth of Chinese goods contains most of the copper intensive products that China exports to the U.S., including products ranging from home appliances to electrical equipment. In our base case, we assume that the 10% tariffs on these goods will be maintained through 2019. Under the 10% tariff, most of the copper intensive goods from China still have a cost advantage over products from other countries. Therefore, the impact on Chinese copper demand is very limited under our current forecast.
"However, the 25% tariff will make a material difference and we estimate Chinese total copper consumption will drop by 0.5% if the tariff is effective on a whole year basis. However, there are only 7 months remaining for 2019. This means that impact on this year's copper demand will only be around 0.2% to 0.3% on top of our current forecast of 1.9% growth for total copper consumption this year."
Aluminium
By Wood Mackenzie Principal Analyst, Uday Patel
"The latest increase in U.S. tariffs on Chinese goods is a modification to the original 21st September introduction of a 10% tariff on $200 billion worth of Chinese goods. For aluminium and aluminium-contained products, the new tariffs represent more of the same, but at a higher pain threshold for U.S. consumers. For direct aluminium semi-fabricated products, such as sheet, China has been busy redirecting exports to other markets since the introduction of Section 232 and duties on common alloy and foil products. Chinese exporters of semis have also been granted exemptions to the tariffs.
"There is a subtle but important difference between the 10th May deadline and the 21st September deadline. The 10th May deadline was softer. Goods that have already left Chinese ports before 10th May will not be subject to the higher tariffs. According to the formal notice increasing the tariffs, the increase will apply to goods that both 1) enter the U.S. for consumption on or after 12.01 am and 2) were exported to the U.S. after 10th May. In other words, at 12.01 am on Friday, the tariff rate will technically be 25%, but only for goods that leave China after that point. Given shipping times of 2-3 weeks, this provides a window for new negotiations. By contrast, in the formal notice implementing the 10% tariff rate on 21st September 2018, the tariff applied to goods that entered the U.S. for consumption after the deadline and there was no similar "in-transit" exclusion."
U.S. imports of aluminium products from China which fall under 25% tariffs
Steel and Iron Ore
By Wood Mackenzie Principal Analyst, Alex Griffiths
"For steel, an escalation of tariffs will just add to the bill paid by U.S. consumers.
"Section 301 tariffs against China will impact less than 1% of all U.S. pre-sanctioned steel trade – compared to around 98% which are covered under Section 232.
"Chinese steel exports to the U.S. have been falling for many years, as a result of a multitude of other duties. Last year, the U.S. imported 0.95 million tonnes of steel from China – or around 3% of all U.S. steel imports – compared to 4.6 million tonnes a decade earlier.
"However, the latest escalation will add to price pressures. The Chinese material that is imported by the U.S. had the highest average value of any imported steel last year – US$2179/tonne compared to an average of US$1091/tonne. This suggests that Chinese steel imported by the U.S. is specialised steel that cannot currently be sourced elsewhere and is, therefore, required by U.S. buyers. Therefore we expect U.S. buyers will continue sourcing those steels from China and absorbing the additional duties themselves. In addition, the U.S. imports around 40 million tonnes of steel through steel-containing goods, some of which come from China. If the increased tariffs stay in place, this will further add to the bill paid by U.S. consumers.
"The U.S. does not import iron ore from China. Therefore, the impact is negligible for iron ore."
Lead
By Wood Mackenzie Principal Analyst, Farid Ahmed
"The key difference for lead between the original 10% tariff, introduced on 21st September last year, and the new 25% rate from 10th May is the inclusion of refined lead onto the tariff list. The impact from this additional commodity will, however, be negligible.
"At the turn of the century, China was typically exporting around 20 kt/a of refined lead to the U.S. By contrast, in recent years, that total has not exceeded 1 kt/a for well over a decade. China’s domestic demand for refined lead has meant they simply haven't had excess production to spare for export. The trade in lead concentrates flows in the opposite direction – into China – as the U.S. has no primary lead smelters but produces over 250 kt/a of contained lead from its mines.
"The Chinese preference has long been to export lead in the form of an added-value product, particular as a lead battery. Unlike the miniscule refined lead exports to the U.S., the export trade in lead batteries has been worth approximately $400 million per annum over the past decade. A 15% hike in tariffs is going to hurt. For several years now, the Chinese industry has focused more on keeping up with growth in domestic demand than satisfying export markets for replacement automotive batteries. These new tariffs could add impetus to the existing drive for China to offshore battery production for export markets to JV companies set up in nearby countries with lower production costs"
Economic Impact
By Wood Mackenzie Principal Economist, Jonathan Butcher
"The tariffs introduced in 2018 had a clear and negative impact. There was a lag before the effects were realised but China trade data showed a fall in volumes from the end of 2018 much greater than normally occurs at that time of year. This was not limited to China-US trade; there were clear spill-overs to other economies.
"The U.S. economy also suffered; a detailed study by Princeton University and the US Federal reserve showed that 2018 tariffs did not result in exporters lowering prices to offset. Instead, the bill has been paid by U.S. consumers and companies. Also, the losses to consumers were greater than the new tariff revenues for the government. In short, the U.S. economy lost out overall.
"We estimate that the negative impact of Friday’s tariff increase could be even greater. The 10% tariff of 2018 was not fully passed on to U.S. consumers – importers have absorbed some of the costs through margin compression. A tariff of 25% is much harder to ignore, and will cause more displacement and disruption to trade flows.
"In addition, the tariffs of 2018 came while the global economy was growing rapidly. That is no longer the case. The Q1 GDP data for China and the US were propped up by temporary factors; we expect both to slow over the coming months. Growth is also weak in Europe and other key areas. We currently forecast global GDP growth to slow from 2.9% in 2018 to 2.6% in 2019. Trade war escalation could almost certainly push this down to 2.3-2.4%, similar to what we saw in 2016."
https://www.woodmac.com/press-releases/trumps-latest-china-tariffs---what-do-they-mean-for-metals/
A trade war between the United States and China is depressing the price of copper and the red metal would be 5% to 15% higher without the dispute, the chairman for Chile’s Antofagasta Plc told a Chilean newspaper on Sunday.
“Without the commercial war, I am convinced that the price of copper would be between $3.20 and $3.50 per pound,” Jean-Paul Luksic said in an interview with El Mercurio.
Despite a rebound on Friday on hopes of an agreement between Washington and Beijing, the value of copper registered its fourth consecutive weekly decline. It is currently about $3 per pound.
Luksic said that the market has good prospects, but the red metal is hurting more than it should be.
The bruising trade war, which has slowed the global economy, is clouding the outlook for demand from top metals consumer China.
“As long as this uncertainty persists, the low prices will continue,” said Luksic, who will also lead the Asia-Pacific Economic Cooperation Summit in Santiago this year.
Traders in Asia said Thursday the impact of US sanctions on the Iranian copper and aluminum sectors would be marginal as Iranian exports to the region were limited.
US President Donald Trump Wednesday signed an executive order imposing sanctions on the Iranian aluminum and copper sectors, the country’s largest non-petroleum source of export revenue, responding to US national security interests, a White House statement said.
China imported 314,181 mt of copper concentrate from Iran in 2018, which accounted for 2% of its total imports of 20 million mt, according to General Administration of Customs data.
China’s copper cathode imports from Iran in 2018 were 15,230 mt compared with its total imports of 3.3 million mt.
Japan and South Korea imported no concentrate or cathode from Iran in 2018, their customs data showed.
Japan imported 41 mt of scrap copper from Iran in 2018.
Iran’s aluminum exports were negligible. In 2018, China imported 160 kg of aluminum foil from Iran.
One international trader, however, said though Iran is not a major copper producer, there may be ripple effects in the tight copper concentrates market.
Some copper concentrates from Latin America have a high arsenic content which smelters could not use, raising spot demand for standard copper concentrate.
“Even more tightness for Chinese smelters which rely on spot concentrate supplies,” he said.
Russian aluminium giant United Company Rusal on Tuesday said its first-quarter net profit fell about 44%, hit by the lingering effects of U.S. sanctions and weaker aluminium prices.
Recurring net profit for the three months to March 31 fell to $300 million from $531 million at the same time last year, Rusal said in a statement to the Hong Kong bourse.
The company said it had seen lower prices in its aluminium sales over the quarter, with revenue declining by about 21% to $2.17 billion.
Washington had imposed sanctions on Rusal, the world’s largest aluminium producer outside China, in April 2018, but lifted them in late-January this year after negotiations and organizational changes in the company.
In April, the firm had flagged weaker aluminium output and value added product sales for the quarter, due to the U.S. sanctions affecting several of its contracts.
“In the coming months Rusal will focus on restoring its market position, including the share of value added products, which will be vital due to ongoing price uncertainty in the global aluminium market and continued U.S.-China tensions,” said Chief Executive Evgenii Nikitin.
Global miner BHP Group will keep its Nickel West operations in Australia amid increasing demand for materials used to make batteries, its chief executive said on Tuesday.
The company has previously made several attempts to sell its nickel operations in the state of Western Australia, saying as recently as 2017 that it was looking for a buyer.
“Developments such as climate change and dramatic shifts in technology present both challenges and opportunities,” Andrew Mackenzie said in a speech to a mining conference in Barcelona that was broadcast over the Internet.
“Nickel West, which we will now retain in the portfolio, offers high-return potential as a future growth option, linked to the expected growth in battery markets and the relative scarcity of quality nickel sulphide supply,” he said.
Nickel is in increasing demand in new battery technologies that mean cars can travel further on a single charge. Using more nickel also cuts costs by reducing the amount of expensive cobalt, a mainstay of current electric vehicle (EV) battery technology.
Western Australia is rich in nickel sulphides which can be chemically processed into sulphate.
Aluminum Corp of China (Chinalco) raised the floor price of non-metallurgical alumina for the fourth time since April in its latest statement, a source told SMM on Tuesday May 14.
The adjustment brought the floor price of alumina to 3,050 yuan/mt, effective on May 14, following the 2,950 yuan/mt set for May 10, 2,850 yuan/mt for April 26, and 2,750 yuan/mt for April 16.
Environmental inspections in Shanxi province drove local alumina producers to cut output or suspend as of Tuesday May 14, and this accounted for higher floor prices.
SMM lowered its estimates for alumina output across major Chinese producers in May, to 5.97 million mt, which translated to a narrower supply glut of 150,000 mt. The expected monthly oversupply marked the lowest since December of last year.
News around output suspension also bolstered spot prices of alumina. SMM assessed alumina prices at 2,850 yuan/mt as of Tuesday May 14, up from 2,646 yuan/m a month ago.
China's production of primary aluminium in January-April increased 4.1% year on year, to stand at 11.48 million mt, showed data by the National Bureau of Statistics (NBS) on Wednesday May 15.
This followed after a year-on-year rise of 3.9% in January-March, standing at 8.57 million mt.
Output of primary aluminium in April expanded 3.9% from a year ago, to 2.92 million mt, after increased 3.4% year on year in March.
NBS data also showed that domestic output of ten nonferrous metals for the first four months of the year gained 5.2% from last year and registered 18.64 million mt.
https://news.metal.com/newscontent/100925969/primary-aluminium-output-in-jan-apr-jumps-41-yoy:-nbs/
The refined copper market will experience supply shortfalls both this year and next, the International Copper Study Group (ICSG) says.
The group has in fact lifted its 2019 deficit assessment to 189,000 tonnes from a forecast 65,000 tonnes at its last biannual meeting in October 2018. Next year’s deficit is expected to be wider at 250,000 tonnes.
These are still marginal numbers given the size of the global copper market - 25 million tonnes - and prey both to statistical error and a highly changeable macroeconomic backdrop.
The rate of demand growth is a key variable and one that is very much to the fore as copper and other industrial metal markets eye nervously slowing global manufacturing activity and trade tensions between the United States and China.
Supply, by contrast, is more knowable and the key takeaway from the ICSG’s latest forecasts is the marked lack of new mine supply expected over the next year and a half.
NO GROWTH, LOW GROWTH
The ICSG is expecting mine supply to be “essentially unchanged” this year, up just 0.2% at 20.64 million tonnes.
The world’s copper mines churned out 2.5% more metal last year thanks to what was by copper’s standards an unusually low rate of disruption.
The ICSG’s forecasts include a “disruption allowance” and 2019 is shaping up to be a more normal year with several major producers already slicing production guidance during the first-quarter reporting season.
Extra supply will come from the new Cobre de Panama mine and the expansion of the Toquepala mine in Peru.
But the impact will be offset by falling output at the giant Grasberg mine in Indonesia as it moves from open-pit to underground operations and the expected negative impact on Zambian production from what the ICSG terms “regulatory/tax issues”.
Improved output from Grasberg in 2020 is the main reason for an expected 1.9% increase in mine production next year, also allowing for potential disruptions. It’s a subdued growth outlook, particularly given it will follow this year’s complete dearth of extra production.
Others, by the way, don’t think that global mine supply will grow at all this year.
The International Wrought Copper Council (IWCC) last month released its own copper market assessment, including a forecast that mine supply would actually fall by 2%, albeit with an expected slightly stronger 2.2% recovery next year.
TIGHTENING RAW MATERIALS MARKET
This lack of mine growth isn’t doing much to support the copper price. London copper has been sliding since the start of the month, hitting a four-month low of $6,007.50 per tonne on Monday.
But it’s clear to see in the raw materials segment of the market in the form of tumbling treatment and refining charges (TCRCs).
The charges for converting mined concentrates into refined metal are a sensitive gauge of raw material availability, falling during times of shortage and rising during times of plenty.
The China Smelters Purchase Team (CSPT), a grouping of some of the largest copper processors in the largest copper processing country, slashed their concentrates purchase floor price by 20 percent for the second quarter.
The minimum smelting charge of $73 per tonne and refining charge of 7.3 cents a pound is the lowest quarterly outcome since at least 2015 and below the annual 2019 benchmark terms of $80.8 and 8.08 respectively.
A tightening concentrates market reflects both the lack of mine growth and increased competition for raw materials within China.
New smelting-refining capacity is coming on stream, injecting an extra demand boost for copper concentrates.
China’s concentrate imports have been running at a record pace so far this year. Cumulative imports totalled 7.24 million tonnes (bulk weight) in January-April, up 17% on last year’s record flows.
Chinese smelters have evidently run the same mine supply numbers as everyone else and are building a stocks cushion in anticipation of the expected concentrates squeeze.
DEFICIT TODAY, DEFICIT TOMORROW?
More Chinese smelting capacity will help lift refined production by 2.8% this year, the ICSG forecasts.
Although there are continued smelter operational issues in Zambia and Chile, last year’s abnormal number of outages is not expected to be repeated.
But this year’s lack of new mine supply will drag on refined production in 2020, limiting growth to 1.2%. Some offset will come from higher secondary production, using scrap as refining input, but the constraint on refined output next year underpins the group’s higher deficit forecast.
The IWCC also expects a “statistical deficit” this year “similar to” the 312,000-tonne shortfall seen in 2018. That’s appreciably wider than the ICSG number but unlike the ICSG the Council is forecasting a return to surplus next year.
Such are the niceties of trying to calculate a snapshot of a 25-million-tonne industrial metal market with myriad moving parts.
The trickiest part of the equation is the demand side because it is subject to multiple product supply-chain dynamics and macro drivers.
The ICSG expects apparent global usage to increase by a modest 1.9% this year and 1.4% next year. “A slowdown in world economic growth is expected to have an adverse impact on world refined copper usage growth in 2019 and 2020,” it said.
The IWCC is in the same ball-park, suggesting a slowdown in growth from 3.4% in 2018 to 1.6% this year and 1.7% in 2020.
That won’t, however, be enough to stop the global market recording a deficit of refined metal this year and, depending on whom you believe, next year as well.
Not that the copper price is paying much attention to supply at the moment. It is the outlook for global demand that is pressuring copper and the rest of the base metals trading on the London Metal Exchange.
Indeed, the ICSG inserts an important caveat to its calculations.
“ICSG recognizes that global market balances can vary from those projected owing to numerous factors that could alter projections for both production and usage, namely the current US-China trade issues, strength of the global economy especially the Chinese.”
A Brazilian federal court has lifted one of two production embargoes on a key plant owned by Norwegian metals maker Norsk Hydro, but output remains curtailed at 50% of capacity, the company said in a statement on Thursday.
Following a spill of untreated water in February 2018, courts and regulators restricted the production of Hydro’s Alunorte alumina refinery, a key supplier to the aluminium industry.
“The Federal Court in Belem, Brazil, lifted the production embargo on Alunorte under the civil lawsuit on Wednesday ... Alunorte is still subject to a production embargo imposed by the same court in a parallel criminal lawsuit,” Hydro said.
“Alunorte is expecting an extension of the civil decision to the criminal case shortly ... (but) will continue to produce at 50% capacity until the production embargo under the criminal case is lifted,” the company added.
A restart of Alunorte would allow Hydro to ramp up production at its nearby Albras aluminium smelter, and to immediately boost profits, which suffered during the outage, the company’s chief executive said recently.
Alumina prices in northern China touched their highest in almost five months on Wednesday as production shutdowns in Shanxi province left the market fearing a shortage of supply.
Xinfa Group, one of China’s biggest aluminium smelters, is closing all production lines on its 2.8 million tonnes per year alumina refinery in Jiaokou, Shanxi amid an environmental dispute, a company source said on Thursday, adding that it was unclear how long the plant would be closed.
Consultancies AZ China and Baiinfo also told clients of the closure, while a logistics source working with Xinfa told Reuters shipments from the Jiaokou plant had come to a halt. Xinfa did not immediately respond to a request for comment.
China’s state-run CCTV last week reported that a Shanxi unit of Xinfa had been dumping red mud, a toxic byproduct of the process that refines alumina from bauxite, in Xiaoyi city. As the dump was left uncovered, the local river system was contaminated and residents complained this was having an impact on crops, CCTV said.
Shanxi is China’s second-biggest region for alumina, a substance used to make aluminium, with 20.24 million tonnes of output last year, according to data from the National Bureau of Statistics.
Spot alumina prices in northern China rose to as high as 2,990 yuan ($435) a tonne on Wednesday, the highest since Dec. 25. The Shanxi situation is also spurring a rally in aluminium prices in China, the world’s top producer and consumer of the metal, which hit its highest level since late October.
“We have lots of inventory in Xinjiang,” the Xinfa source said when asked about tighter alumina supply, referring to the northwestern Chinese region that houses around half of Xinfa’s aluminium capacity. The company also has smelters in Shandong.
Xinfa also has a 1.2 million tonnes per year alumina refinery in Xiaoyi but this will not be closing for now, he added.
Citing logistics sources, AZ China managing director Paul Adkins said in a note that Xinfa’s alumina deliveries to remote customers would stop on Wednesday and nearby deliveries would cease from May 23.
“We have not seen any notice of force majeure yet, but that could come after today’s meeting” between Xinfa and the local government, Adkins added. The Xinfa source confirmed such a meeting had been due to take place.
Another 450,000 tonnes per year alumina plant in Xiaoyi belonging to Huaqing Aluminium has also closed in light of the environmental dispute, according to AZ China and Baiinfo. The company could not be reached for comment.
https://www.hellenicshippingnews.com/china-alumina-prices-spike-on-shanxi-shutdowns/
TEHRAN, May 12 (MNA) – The secretary of Iran Aluminum Industries Syndicate Abolfazl Rezaiee announced that despite US sanctions on Iran’s metal industry, the country will continue exporting of aluminum to its neighbors.
“Afghanistan, Turkey and Iraq are our major exports destinations for aluminum and the recent US-led sanctions will have no impact on exports to these countries unless banking difficulties impede us from the set target,” he said.
He described that the new sanctions can push the total production prices up but the biggest challenge for Iran’s aluminum industry has been supplying the needed raw materials via imports, which has been done by swapping under previous sanctions.
On Saturday, Chairman of Iranian Steel Producers Association (ISPA) Bahram Sobhani called for modifying and correcting internal regulations for countering sanctions in the field of steel exports.
Turning to the restrictions created for exporting steel products of the country, he added, “to reduce impacts of sanctions, internal instructions should be facilitated and existing barriers should also be removed.”
In his reaction to the limitations created by US government for exporting some metal products of the country such as steel, he stated, “under such circumstances, domestic steel producers are advised to produce steel in the country.”
The Trump administration announced new sanctions on Iran's metals sectors; steel, aluminum and copper industries, on Wednesday.
Trump's executive order came hours after Iran announced it was withdrawing from parts of an Obama-era nuclear agreement, known as JCPOA.
Mehrnews
Almost 70% of capacity across small secondary lead smelters in Guangdong were forced to suspend after Beijing-led environmental inspection teams visited the province this week, an SMM survey found on Thursday May 16. A falling market also accelerated their closure.
Large smelters of secondary lead in Guangdong saw minimal impact.
In Jiangxi provide, a couple of licensed secondary smelters were also ordered to close, for no longer than four days, SMM learned.
China's Ministry of Ecology and Environment said on Thursday May 9 that it will send teams to 25 provinces and cities to step up local environmental supervision over water and waste.
Poland's KGHM may beat production goal at Sierra Gorda
Polish mining company KGHM may produce more copper than planned at its Sierra Gorda mine in Chile in 2019, while keeping capital expenditure (capex) below target, its deputy chief executive in charge of foreign assets said on Thursday.
“We see a chance to limit capex at Sierra Gorda while maintaining a positive trend in production,” said Pawel Gruza.
“The chances are that production in Sierra Gorda will be higher than assumed in the budget.”
China produced 740,000 mt of refined copper in April, up 1.5% from a year ago, showed data from the National Bureau of Statistics (NBS).
The brought output in the first four months of 2019 to 2.985 million mt, up 7.3% from the same period last year.
NBS data also showed that China’s output of zinc in January-April declined 4.4% from a year ago and stood at 1.765 million mt. Zinc production in April was 0.4% lower than April 2018, standing at 465,000 mt.
Output of lead came in at 494,000 mt in April and 1.924 million mt in January-April, up 22.9% and 18.6% year on year, respectively.
The Oyu Tolgoi mine, in Mongolia, has had a strong start to 2019, with copper and gold production in the openpit mine rising strongly, standing Vancouver-based Turquoise Hill in good stead to meet its production guidance for the year.
During the first three months of the year, Oyu Tolgoi produced 45 800 t of copper and 120 000 oz of gold, compared with 38 800 t of copper and 42 000 oz of gold a year earlier.
Turquoise Hill generated revenue of $352.7-million in the first quarter, up 44% on the first quarter of 2018, reflecting the significant increase in gold production as higher gold content ore were processed.
The mine’s cost of sales was $1.99/lb of copper sold, C1 cash costs were $0.77/lb of copper produced and all-in sustaining costs were $1.45/lb of copper produced.
For the March quarter, Turquoise Hill recorded income of $105.2-million and net income attributable to owners of the company of $111.2-million.
"Oyu Tolgoi has made a strong start to 2019," said Turquoise Hill CEO Ulf Quellmann.
Commenting on the delays to underground mining, he said that Oyu Tolgoi remained engaged with mine manager Rio Tinto to incorporate new geotechnical data into the mine design.
“We expect to provide an update along with our mid-year results.”
The company previously advised that Rio Tinto would complete a review of the Shaft 2 schedule and that outcomes were expected by the end of October.
Turquoise Hill owns the mine in a 66:34 partnership with the Mongolian government, but while it is seen as one of the most lucrative copper/gold properties under development, Oyu Tolgoi has been dogged by political challenges, corruption investigations and construction delays.
Oyu Tolgoi mine was initially developed as an openpit operation. The copper concentrator plant, with related facilities and necessary infrastructure, was originally designed to process about 100 000 t/d of ore from the Oyut openpit. Since 2014, the concentrator has improved operating practices and gained experience, which has helped achieve a consistent throughput of more than 105 000 t/d. Concentrator throughput for 2019 is targeted at 110 000 t/d.
In August 2013, development of the underground mine was suspended pending resolution of matters with the government of Mongolia. Following signing of the Oyu Tolgoi underground plan in May 2015 and the signing of a $4.4-billion project finance facility in December 2015, Oyu Tolgoi received formal notice to proceed approval by the boards of Turquoise Hill, Rio Tinto and Oyu Tolgoi in May 2016, which was the final requirement for the restart of underground development.
Underground construction restarted in May 2016. Since then, a total of $2.6-billion had been spent on underground construction. Another $1.3-billion to $1.4-bilion is earmarked for underground development this year.
Oyu Tolgoi is expected to produce 125 000 t to 155 000 t of copper and 180 000 oz to 220 000 oz of gold in concentrates for 2019.
https://www.miningweekly.com/article/oyu-tolgoi-going-strong-despite-shaft-delays-2019-05-16
China will tighten approvals of steel capacity swapping between companies and ban all new steel capacity in any form, the country’s economic planner said on Thursday, in order to streamline the sector.
The announcement follows illegal capacity expansions approved by local governments under the cover of capacity swaps, where companies move capacity between different regions to reduce the concentration of plants in polluted industrial areas. The new facilities have undermined Beijing’s efforts to reduction pollution and reduced steel capacity.
Additionally, China will control steel-making capacity in key pollution-control areas, including the Beijing-Tianjin-Hebei region and the Yangtze River Delta, by imposing more strict environmental, energy, land and water usage standards, the National Development and Reform Commission (NDRC) said in a statement.
China, the world’s biggest steel producer, has eliminated more than 150 million tonnes of crude steel capacity in the past three years. There are around 980 million tonnes remaining, nearly half of the world’s total.
The central government will carry out inspections on capacity cuts to prevent closed projects from reopening, according to the NDRC statement.
The NDRC also said it will encourage mergers and restructuring in the steel, coal and coal-fired power sectors this year, and will eliminate all so-called zombie firms, companies with outdated equipment and debt that are no longer competitive, by forcing them to shut down or merge with other companies by 2020.
Since 2016, China has disposed of more than 1,900 zombie firms and heavily-indebted companies.
The NDRC last year had ordered local governments to help broker deals between zombie firms and their creditors, and to draw up restructuring plans by June 2019.
Steel mills will also be encouraged to launch large-size scrap recycling and processing centers and to adopt electric-arc furnaces that only use scrap metals to make steel and emit less toxic air compared to widely used blast furnaces.
The NDRC also said in the statement that it will support Chinese steel mills to set a “more reasonable” pricing mechanism on imported iron ore. It will also study how to boost the development of domestic iron ore miners and increase ore supply in the country.
China, the world’s largest iron ore consumer, imported 1.064 billion tonnes of iron ore in 2018.
Chinese steelmakers are regaining their appetite for high-grade iron ore despite record-high ore prices, mill managers and traders say, as recovering profit margins spur plants to seek efficiency gains and ramp up output.
Steel firms had been forced to slash input costs through switching to low-quality ore in late 2018 as steel margins dived amid record output. A sharp surge in iron ore prices in early 2019 - sparked by a catastrophic tailings dam failure at a Vale SA mine in Brazil - also fueled that switch.
But as China’s economic growth revved up in the first quarter, and tighter anti-pollution measures came into effect, executives gathered an industry conference in Singapore this week also said higher quality - and higher priced - ore is very much back on the menu.
“We have signed abundant orders for steel products for the coming three months and steelmaking is quite profitable,” said a purchasing manager at a mid-sized mill in China’s top steelmaking province of Hebei. “It’s time to buy more high-grade ore,” he said, declining to be identified as he was not authorised to speak to media.
Beijing’s anti-smog drive is also helping.
China’s environment ministry last week ordered mills to target ultra-low emission levels to improve air quality, meaning advanced equipment and better quality iron ore.
“In the longer term, because of the changes in the Chinese steel industry...as well as tighter emissions controls, we see a very significant demand pool and preference for high-grade iron ores,” said Siddarth Aggarwal, market analysis manager for iron ore and ferrous trading at Anglo American.
Prices of 65% iron-content ore for delivery to China hit a five-year-peak of $110.5 a tonne on Thursday, while its premium to benchmark 62 percent ore widened to five-month highs.
“That talks to an industry that is moving towards efficiency, productivity, cleaner practices and therefore you need high-grade iron ore,” Aggarwal told Reuters on the sidelines of the Singapore conference.
Inventories of imported iron ore at Chinese ports have fallen to their lowest since October 2017 to 133.6 million tonnes, according to data from consultancy SteelHome.
TAKING A SLICE
The ore market outlook is also underpinned by the estimated 98 million-tonne supply gap left by Brazil’s Vale following the in Brumadinho dam disaster in late January, which killed hundreds.
Some high-grade ore products, such as Vale’s Carajas fines with iron content at 65%, are now in short supply.
Miners elsewhere have tried to boost high-grade output in an effort to win a share of the premium market, including Australia’s Fortescue Metals Group (FMG), which traditionally sells mainly low grade 58% ore.
The company shipped its first cargo of 60.1% ore content West Pilbara Fines to China in December, and expects output of the new product to reach 5-10 million tonnes in 2019.
FMG also recently announced a $2.6 billion expansion of its Iron Bridge Magnetite project in Western Australia, expecting to produce 22 million tonnes of iron magnetite concentrate at 67% grade by mid-2022.
Meanwhile, China’s domestic miners are also dialing up output of higher-grade ore, and analysts expect Chinese miners to add around 10 million tonnes of supply in 2019, mainly high quality ore with low impurities.
Brazilian miner Vale SA expects to restore capacity lost after the deadly Brumadinho tailings dam burst ithin two to three years, executives said on Friday, emphasizing that the company is not rushing to resume full output.
The dam’s collapse, which came a little over three years after a similar accident at a joint venture in the same state with BHP Group, has led to months of turmoil at Vale, culminating in a $1.64 billion quarterly loss reported on Thursday.
The world’s largest iron ore miner has been forced to take some 90 million tonnes of production capacity offline since the disaster, some voluntarily but much under pressure from courts and regulators aiming to avoid another disaster.
“We’re not in a hurry,” Chief Financial Officer Luciano Siani told analysts on a conference call. “We’re working together with prosecutors and the authorities with a common objective: making sure that there won’t be any kind of resumption until there is absolute safety.”
Vale on Thursday announced nearly $5 billion in writedowns for various costs related to the disaster, emphasizing that the total tab remained unclear.
Vale Chief Executive Eduardo Bartolomeo, named in March under pressure from prosecutors to replace Fabio Schvartsman in the post, said the miner was fully committed to paying reparations to those affected by the dam collapse, which killed at least 237 people.
Vale shares rose 2 percent on Friday as investors focused on signs the miner is pushing to settle its legal and operational woes.
“The fact that they are accelerating negotiations to turn the page on this is a sign that the market sees the effort positively ... that will allow Vale to refocus on normalizing its situation as much as possible,” said XP Investimentos equity research head Karel Luketic.
Vale CFO Siani said the company expects about 20 million tonnes of lost capacity to come back online fairly quickly once it persuades a judge to allow its Brucutu mine, which the company insists is safe, to restart production. Brucutu is now only producing iron ore using “dry processing,” and is operating at a third of total capacity.
Another 30 million tonnes of production frozen by court orders is likely to come back on line within six to 12 months using dry processing, Siani said.
A final 30 million tonnes, reliant on wet processing that require the use of tailings dams, could take two to three years to gain clearance, he said.
Turning to Samarco, whose 2015 collapse caused what is widely regarded as Brazil’s worst-ever environmental disaster, Siani said he expected the joint venture to get licensing approval by the end of September, then resume production in the second half of 2020.
The transoceanic iron ore market will run a deficit of at least 40 million tonnes in 2019, according to forecasts from the British consultancy CRU.
In Brazil, Bradesco BBI has a similar projection: a deficit of 45 million tonnes this year. This situation will cause iron ore prices to remain high throughout the year, ranging from US$80 to US$100 per tonne in the bank’s accounts, and between US$80 and US$90 for the remainder of 2019, in CRU’s projections.
The reduction in iron ore global supply results from two major factors: the Brumadinho tragedy, in Minas Gerais in January, and the outbreak of tropical cyclones in Australia in March.
Erik Hedborg, a senior iron ore analyst at CRU, said there is an increase in iron ore supply in other parts of the world, such as India, China, and Iran, although not enough to compensate for the loss of major producers (Australia and Brazil) resulting in inventory reduction. Destocking will be an additional source of supply.
There is a similar assessment among bank analysts: the inflow of other producers will not be enough to compensate for the deficit. According to Karel Luketic, XP’s mining and steel industry analyst, long-term price visibility (2021-2022) is lacking, inhibiting investments in new iron ore capacities by non-traditional players in the sector.
Itaú BBA also recently pointed out the market’s difficulty in compensating for the loss of iron ore production in Brazil.
“The market will be better balanced next year as Australia’s major producers recover and Vale’s northern system [in Pará] keeps increasing supply,” said Hedborg of CRU. He said the major Australian mining companies are unable to further increase production.
Demand, in turn, has been strong this year, Hedborg said: “Chinese steel companies were able to produce slightly more than in the first quarter of 2018. Following milder restrictions in April, output has soared and we are seeing stronger demand in the short-term. However, demand will be somewhat weaker in the second semester,” said the CRU analyst.
China has been the main source of global demand for minerals and metals. In 2018, Chinese purchases represented 72 percent of global demand for iron ore, 51 percent of demand for nickel and 49 percent for copper.
Hedborg estimated iron ore prices to be “very high” in 2019. However, he said: “We are predicting that prices will fall slightly in the second half of the year as supply outside Minas Gerais recovers, while we see the weakest market in China.”
In his opinion, prices will remain between US$80 and US$90 per tonne for the remainder of the year. “However, things can change quickly, based on new suspensions or mines resuming operations in Brazil,” he said.
Bradesco BBI, in turn, recently increased its average price estimate for iron ore from US$ 80 to US$ 90 per tonne, on a yearly average basis for 2019.
The bank’s report projected that Vale would fail to sell some 60 million tonnes this year, while Australians would fail to place 25 million tonnes on the market as a result of hurricane activity in the country.
Vale tends to be the main loser in this scenario, experts say. It is possible that the company will lose market shares to Australian competitors if it takes longer to resume production.
It may even be overtaken by Rio Tinto as the world’s largest producer of the commodity. The mining company pointed out that Brumadinho’s impact on the company’s iron ore production amounts to 93 million tonnes per year.
The rise in met coal prices in Asia-Pacific markets this week is also tightening relative price variations between FOB Australia and coking coal markets in China.
Stay up to date with the latest commodity content. Sign up for our free daily Commodities Bulletin.
Sign Up The rise in met coal prices in Asia-Pacific markets this week has tightened the spread between the FOB Australia and Chinese markets.
Demand for restocking to meet higher steel output in China and India may be leading the trend, with met coal supported by rising costs for iron ore and a move to use lower quality ores.
China and India boosted pig iron output in the first quarter of 2019 compared with last year's levels, with China's growth rate at 9%. A slightly weaker rise in early April steel output was reported by China industry group CISA.
The spread between lower-priced Premium Low Vol CFR China and comparable quality in China's domestic market narrowed to $16.88/mt as of Wednesday.
That was down from an average $24.542/mt for imports in April compared with domestic coal prices adjusted for comparisons on a CFR basis.
On Thursday, PLV FOB Australia was steady at $209.25/mt FOB, while PLV CFR China rose $2/mt to $210.50/mt CFR.
The spread between PLV FOB and the PLV CFR China netback to Australia FOB narrowed to $9.70/mt on Thursday, from April's average of just over $12/mt.
Tighter pricing between markets for benchmark grade coal may be viewed as a normalization after looser pricing relationships based on external trade and policy measures.
Curbs to steel production in China to lower air pollution during the country's winter, may have ended up more specific and targeted than earlier anticipated, and lifted coke consumption overall at compliant mills.
Trade restrictions in China and Turkey adding to costs for importing US coals, and lengthier delays for imports clearing customs in China, saw import prices lagging domestic prices in China.
Volatility in China's coke market after a steep market correction in March and price recovery since may be keeping domestic prices higher, with China's steel production growth this year adding to demand for imports.
To blend with domestic coals, buyers are keen to buy lower sulfur, lower ash coals , with phosphorous content also attracting more attention, according to suppliers.
Privately held Pembroke Resources on Tuesday won approval from Australia’s Queensland state to develop a $700 million coking coal mine, as it pushes to tap strong demand for the steelmaking ingredient in Asia.
Construction is due to start next year, with the company looking to begin negotiating contracts soon for supplies of coal from the mine, Chief Executive Barry Tudor told Reuters.
“In developing the mine, our preferred course is to obtain some project finance. And as a component ... we anticipate we will need to put in place some offtake agreements,” he said.
“We haven’t entered into any offtake or supply agreements yet. We got an approval today, so we can advance those discussions in a more tangible way now.”
Pembroke has been talking to potential customers in Japan, South Korea and India, and is also open to selling a stake in the mine that will eventually produce 15 million tonnes of nigh-quality coking coal a year out of the state’s developed Bowen Basin.
Tudor said Pembroke had seen a lot of “inbound interest” in the project and that he saw advantages in selling a stake. “There’s sales and marketing, you need to brand your product and there’s potential offtake,” he said. “Absolutely the door is open.”
The mine is expected to create 1,000 operational jobs and 500 jobs during construction, Queensland Premier Annastacia Palaszczuk said in a statement.
The approval comes as the state Labor government has faced criticism for prolonging a review of the controversial Adani thermal coal mine, and ahead of an election at the weekend.
Appetite for thermal coal, used to create heat, has been fading as renewable energy becomes more popular. But coking coal, which has a higher energy content, is vital for steel production.
Ahead of the S&P Global Platts Global Metals Awards in London, on May 16, The Barrel presents a special series of articles looking at the global metals trade. Paul Bartholomew and Jing Zhang take an in-depth look at China’s steel production in recent years, and the likely trajectory in 2019.
Just a few years ago, market updates from major iron ore producers Rio Tinto and BHP routinely stated that they expected Chinese crude steel production to reach 1 billion metric tons by the end of the next decade.
This sounded like an incredible amount of steel, particularly as China’s economic growth trajectory was heading south. Further, such a prediction seemed unrealistic given China’s steel output had retreated by 2.3% in 2015 to just under 804 million mt.
For many Chinese government officials and steel analysts, the argument went something like this: steel consumption had peaked in 2014, Beijing was slashing steel capacity under its supply-side reform agenda, and the country was shifting toward a higher-value, consumption-driven economy based on cleaner technologies.
In short, the era of massive industrial capacity build, so-called “ghost cities”, toxic assets, ballooning debt and excess that China was known for, was coming to an end. China had embarked on a new era of sustainable growth, with its “blue skies” anti-pollution policy at the fore. In this setting, surely there was no way steel output would ever reach 1 billion mt?
So it came as a huge surprise that steel output increased by 15% over the past two years. China produced a record 928 million mt of steel in 2018, up 6.6% on the year before, according to the World Steel Association. Most forecasts at the start of the year envisaged output growth of 1%-2%. Perhaps the 1 billion mt mark was not so far-fetched, as it would require less than 1% CAGR over the next 10 years to reach this level. Indeed, China started 2019 at a gallop: February’s steel output of 71 million mt was up 9.2% on the year before.
S&P Global Platts expects steel production to rise this year by 2%-3% to 947 million-956 million mt as mills keep run rates high to take advantage of decent margins.
The key concern for the rest of the world is that if China’s economy slows and domestic demand is not strong enough to absorb all of the steel it produces, its exports could destabilize global steel prices as they did over 2014-2016. During this period, China exported more than 100 million mt of steel each year. By the end of 2015, steel and raw materials prices reached a nadir.
In the Midwest region of the United States, domestic hot-rolled coil prices averaged $373/short ton in December 2015, lower even than during the global financial crisis and 40% down on the same month a year earlier. Not surprisingly, many international steel companies were forced to slash production and staff, unable to continue operating at sub-economic prices. Some steel companies never recovered and were subsequently forced to find a buyer. A plethora of antidumping duties have been introduced to protect local steel industries and last year the US applied a 25% import tariff on steel from many countries. But trade protection measures often just shift the supply pressure problem from one place to another: as one door closes, exporters try to open another.
The topic of China’s steel overcapacity has often been brought up at international government meetings, such as the G20. China has long been the US steel industry’s bête noire – despite Chinese steel accounting for less than 2% of US steel imports – and the Section 232 import tariffs on steel and aluminium have proliferated into a wider trade conflict.
Capacity creep
China would argue it has been trying hard to reduce its capacity. It closed down around 140 million mt/year of unlicensed induction furnace (small scrap-fed rebar making facilities) capacity in 2017, and completed the removal of 150 million mt/year of legitimate steelmaking capacity over 2016-2018. In principle, companies are only to build new facilities if they remove a similar volume of capacity.
One of the reasons for the high steel production growth in 2018 could be that induction furnace production in 2017 was never included in the official data.
Notwithstanding the closures, the fact is that China already has steel capacity of 1.15 billion mt/year, S&P Global Platts estimates. And the country is building more. China will commission about 34 million mt/year of crude steel capacity via the basic oxygen furnace/blast furnaces route this year, and another 15 million-17 million mt/year of electric-arc furnace capacity, Platts estimates.
China wants to produce more steel from EAFs as this is considered to be better for the environment. As a result, there appears to be more flexibility and concession around new EAF capacity. Though the commissioning of new facilities is predicated on closures of existing iron and steel making capacity of equivalent or even slightly higher volumes, the numbers indicate there will be a net capacity increase this year.
Last year China commissioned nine new hot strip mills, with combined production capacity of around 25.35 million mt/year. This year will see another 12 new hot strip mills with capacity of 25.1 million mt/year come online, taking the total over two years to more than 50 million mt/year, according to Platts analysis.
In 2018, Chinese steel demand was extremely strong. Margins and prices hit six-year highs at times, and finished steel exports fell to a relatively modest 70 million mt. But in the final quarter, the market rapidly deteriorated as China’s efforts to control debt and spending resulted in a tightening of liquidity. China’s GDP slowed to 6.4% in Q4, as Beijing took steps to stimulate the economy. Further, expectations that China would tighten up steel production in winter to curb emissions were priced into the market. But prices eased when these output constraints were loosened in response to the weaker economy.
Outlook unspectacular
Domestic steel rebar margins averaged $133.3/mt in the first half of 2018 and $130.8/mt in the second half, indicating the resilience of the property construction sector. Domestic HRC margins averaged $132/mt in H1 but fell to $99.7/mt in H2, according to Platts analysis.
HRC is the main steel product used in manufacturing, which has been struggling due to weakness in consumer segments, such as automotive, white goods and appliances. Many consumers are highly leveraged to property and have found it harder to borrow money. Last year auto production fell for the first time since the early 1990s. Beijing plans to introduce some measures this year to stimulate demand in those segments, but overall the flat steel market may not grow much on last year.
The outlook for long steel products, such as rebar, is more positive as there is still a solid pipeline of construction work ahead. Property market investment increased by 11.6% year on year to Yuan 1.2 trillion ($0.18 trillion) over January-February, according to the National Bureau of Statistics. Funding for residential property projects accounted for 72% of the total, up 18.0% year on year to Yuan 0.87 trillion. But house prices softened at the start of this year and S&P Global Ratings expects the property sector to contract by 8%-12% in 2019.
Beijing has also stepped up investment in infrastructure through issuing local government bonds after growth in the sector slowed last year. China’s fixed asset investment in infrastructure increased by just 3.8% on year in 2018 – a big slowdown from 19% growth in 2017 – due to the nationwide deleveraging campaign.
China issued Yuan 1.22 trillion ($0.18 trillion) of local government bonds between January and March. Investment in infrastructure construction rose by 4.3% year on year in the first two months of 2019, while investment in rail transport increased by 22.5% year on year.
But incremental demand growth from infrastructure is likely to be mild, while the overall steel demand outlook for the rest of the year is solid at best. In November, the World Steel Association forecast flat demand growth in China this year but acknowledged there would probably be an “upside to our forecast.” More positively, ANZ Bank said in late March that it had revised its forecast for Chinese steel demand growth this year to 4.5% from 3%.
Beijing needs to maintain solid economic growth and job creation without overcooking things and contributing to the debt mountain. The People’s Bank of China has already said there will be no stimulus “flood” this year. There will be a tweak here and there, some fiscal levers pulled when necessary. But all the signs indicate a “steady as it goes” kind of year.
Given the increase in capacity outlined above, the likely level of crude steel production this year, and the muted demand and price outlook, exports look set to rise on last year. Some Chinese steel mills said they expected an increase of 5%-10% on last year’s 70 million mt. While it is unlikely there will be a return to the dark days of several years ago, additional volume into the market will pressure regional steel prices and could bite into steel margins this year.
https://www.hellenicshippingnews.com/chinese-steel-output-rises-relentlessly-despite-plant-closures/
Elaborating on the difference between the Indian and European steel markets, TV Narendran added, "Indian market is growth-oriented while the European market is product-mix and portfolio oriented market. In India, a growth of 5 per cent or above is considered impressive while in Europe a 1 per cent growth is praiseworthy."

A tipping point for this fossil fuel?
Photographer: Carla Gottgens/BloombergFossil-fuel advocates have a favorite rejoinder to those who predict a global shift to renewable energy: Coal has never been more popular.
It’s a decent argument because it happens to be true. While coal-fired power has declined by nearly a quarter in Europe and almost 40 percent in North America over the past decade, the change has been overwhelmed by a 63 percent increase in Asia.
That makes ambitions to prevent more than 1.5 degrees Celsius of global warming seem all but out of reach. Making matters worse, there’s a further 236 gigawatts of plants under construction worldwide, according to the Global Coal Plant Tracker, an online database operated by climate activist groups. Put together, that’s enough to add another quarter to the current fleet of turbines.
The tide may finally be turning, though. Final investment decisions, or FIDs, for coal plants have fallen by about three-quarters over the past three years, from about 88GW over the course of 2015 to around 22GW in 2018, according to the International Energy Agency’s latest world investment report released this week.
The full significance of that figure isn’t apparent until you compare it to the pace at which plants are shutting down. Some 30GW of generators were retired last year, so more capacity was closed in 2018 than was approved – almost certainly the first time this has happened in a generation, and possibly the first time since the 19th century. When FIDs drop to zero, the 140-year era of coal plant construction will finally be over.
It will take a few years for that to work its way through the system, since plants typically take about four years to build after reaching FID. Still, the peak in global plant capacity could be just months away.
“This is a sneak preview of where we’ll be in three to four years time,” said Tim Buckley, director of energy finance studies at the Institute for Energy Economics and Financial Analysis, a research group that favors energy transition. “If closures stay where they are, we’re at peak by 2021.”
Of course, there’s still 236GW of projects under construction – but announced retirement plans already offset almost all of that:
In April the prices of coal delivered to Europe fell to the lowest level since June 2016, Industrial Development Agency (IDA) data showed. The decrease in prices is due to the systematic increase in inventories and a significant decline in coal use. In Germany, for example, coal accounted for only 8 percent of total energy production.
The total consumption of coal in Germany, Spain, Great Britain, and France dropped almost by half compared to March. According to analysts, even in the case of a short-term increase in coal demand in Europe, this will not be enough to stimulate the growth of prices, because of the high inventories level in European ports. In the last week of April, the inventories were at 6.85 million tons.
https://www.hellenicshippingnews.com/european-coal-prices-are-the-lowest-in-nearly-three-years-ida/
South Africa’s Kumba Iron Ore Ltd said on Tuesday first-half headline earnings is expected to rise at least 160 percent, boosted by higher iron ore export prices and a weaker rand/U.S. dollar exchange rate.
The company, a unit of Anglo American Plc, said headline earnings per share is expected to increase by at least 14.9 rand in the six months ending June 30 from 9.31 rand a year earlier.
Headline EPS is the primary profit measure in South Africa, and strips out certain one-off items.
https://www.hellenicshippingnews.com/s-africas-kumba-iron-ore-sees-higher-h1-headline-earnings/
By Rebecca Keenan
(Bloomberg) -- Brazil is considering options to offset
shuttered iron ore supply as Vale SA’s fatal dam collapse and
knock-on closures are seen by the government cutting the
nation’s production by 10% this year.
“We have reserves and capacity to produce and we are
improving these capacities,” Alexandre Vidigal de Oliveira,
national secretary of Brazil’s ministry of mines and energy,
said in an interview on Thursday in Perth, speaking through a
translator. “The mines that exist now have the potential to grow
in production.”
Exports from Brazil in April hit a seven-year low in the
wake of the crisis. The outages --paired with record steel
production in China in the first four months -- have seen prices
surge this year -- and they are just one more shock away from
topping $100 a ton, according to Barclays Plc.
Vale, the top producer, has warned it will take two-to-
three years to meet the 400 million ton output target the
company had originally set for 2019, Chief Financial Officer
Luciano Siani Pires said this month. The company halted
operations with a combined capacity of 93 million metric tons to
improve safety after the dam disaster in January that left
hundreds dead.
“We have to consider the cause of the collapse and we are
still investigating what happened,” Oliveira said, who expects a
return to normal operations in the medium-to-long term, but
added the outlook for next year was less clear. The government
has ordered all similar dams to be shuttered by 2021, he said.
Iron ore for June traded 3.1% higher at $95.17 in Singapore
at 1:54 p.m. On Wednesday benchmark spot ore rose to $94.60, up
30% this year, according to Mysteel Global. Last month, the spot
price hit $95.90, the highest since 2014.
Oliveira is part of a delegation that will visit Fortescue
Metals Group Ltd.’s giant Pilbara operations to inspect new
technology and broaden his ministry’s knowledge. Fortescue Chief
Executive Officer Elizabeth Gaines said her company has been
building its relationship with South America for some time.
“We are proud to showcase our innovative operations, world-
class assets and unique culture to representatives from the
Brazilian Government,” she said by email.
China’s benchmark iron ore futures jumped to a record high in early trade on Thursday, rising along with the rest of the country’s ferrous complex on robust demand for the steelmaking feedstock amid tightening supply.
Steel prices were also higher, buoyed by expectations that downstream demand in the world’s top consumer will remain strong.
The most-traded September 2019 iron ore contract on the Dalian Commodity Exchange rose as much as 4.5% to hit 678.5 yuan ($98.62) a tonne.
“It’s because of some seasonal demand, which is quite strong, with some impact from the supply side,” said a Shanghai-based trader.
Steel mills were replenishing their iron ore stocks as good profit margins encouraged them to boost output, the trader said.
China’s crude steel production rose 12.7% in April from March to its highest monthly level on record, official data showed on Wednesday, bolstered by firm demand and good profitability.
The most-active construction steel rebar contract on the Shanghai Futures Exchange climbed 1.6% to 3,736 yuan a tonne, extending gains after it touched a five-week low earlier this week on concerns about the U.S.-China trade war.
Worries about the trade tensions have eased somewhat after the two countries’ tit-for-tat tariff war rattled financial markets in recent days.
U.S. Treasury Secretary Steven Mnuchin said on Wednesday he will likely travel to Beijing soon to continue negotiations as the world’s two biggest economies try to salvage talks aimed at ending their months-long trade war.
Hot rolled coil rose as much as 1.4% to 3,658 yuan a tonne.
Other steelmaking raw materials also extended gains, with coking coal up 1.4% at 1,369 yuan a tonne and coke up 2% to 2,153 yuan.
National Mineral Development Corporation Limited (NMDC Ltd) is in the process of investing about USD 1 billion on infrastructure in the next three years to help ramp up iron ore production, a senior official of the public sector undertaking has said.
Amitava Mukherjee, Director (Finance), said that the cost of the upcoming 3-million tonne capacity steel plant would go up to Rs 19,000 crore against the estimated over Rs 15,500 at the time of conception. The iron ore miner has already invested nearly Rs 14,500 crore on the plant.
“The mine capacity is also being increased. We are investing about USD 1 billion…The production of steel-making would go from the current capacity of 146 million tonnes per annum to 300 MTPA, and I see a market in future in domestic ore consumption,” he said.
“About USD 200 millions have already been invested in different projects. We expect all this (investment) to be completed by 2022 to 2023,” Mukherjee told PTI. “At Bailadilla in Chhattisgarh, the company is creating a rapid wagon-loading system for evacuation and setting up a new slurry pipeline. It is also in the process of doubling of railway line between Kirundul and Kothavalasa (KK line),” he said.
The PSU is also setting up screening plants in Karnataka and Chhattisgarh.
‘We are at par’
On the upcoming steel plant in Chhattisgarh, Mukherjee said the company was investing Rs 2,000 crore and its commissioning was expected before the end of this fiscal. “Mecon ( project consultant) is doing the revised estimation. Ballpark figure of the total investment on the plant should be between Rs 18,000 crore and Rs 19,000 crore,” he said.
“If you compare the cost per tonne for a greenfield project all over the world, we are at par. The cost of production at the mining head is as good as that of the top big players around the world,” he said.
Replying to a query, he said without production from Donimalai mines in Karnataka, NMDC expects 31-32 million tonnes during the current fiscal. The miner suspended iron ore mining from its Donimalai mine following the Karnataka governments decision to impose 80 per cent premium on the ore sales from that mine.
NMDC, in November 2018, had moved the High Court challenging the Karnataka government decision on imposition of the premium on Donimalai ore.
Hoping that the court decision would come in their favour, the NMDC official said that any verdict against the company may have a negative impact on merchant mining sector of the entire iron ore industry as it cannot afford to absorb higher premiums and it may set benchmark for future auction by other states.
https://www.hellenicshippingnews.com/nmdc-to-invest-1-billion-on-infrastructure-says-official/
With construction progressing smoothly, the first stage of a stainless steel bar project in Jiawang district of Xuzhou city, Jiangsu province, is expected to commence operation at the end of August, according to a report on the official website of Jiawang government.
With designed capacity of 1.6 million mt, the project is owned by Xuzhou Delong Metal Technology. The first stage has capacity of 800,000 mt.
After being wholly commissioned, the project is estimated to generate sales revenue of up to 10 billion yuan a year, and create more than 700 jobs.
Para compartilhar esse conteúdo, por favor utilize o link https://www.otempo.com.br/cidades/defesa-civil-alerta-para-movimenta%C3%A7%C3%A3o-de-talude-perto-de-barragem-da-vale-1.2181455 ou as ferramentas oferecidas na página.
China's thermal coal demand has been on the rise in the lead up to the summer peak season, but high inventories at power plants could continue to put pressure on thermal coal prices in the coming weeks, Citi analysts said in a note Thursday.
The country generated a total 544 TWh of electricity in April, which is an increase of 3.8% year on year. However, this was down 4.5% from March when China generated around 569.8 TWh, according to data by China's National Bureau of Statistics released Wednesday.
"The weakness in power demand echoes tepid industrial production, which may come to an end if policy stimulus accelerates," according to the research note.
The NBS data showed that thermal power generation in April decreased 0.2% year on year. Power generation from renewable energy showed strong performance in April with hydro generation up 18.2%, while nuclear and solar energy jumped 28.8% and 13.4%, respectively.
Renewable energy including hydro, nuclear, wind and solar power accounts for 25.4% of power generation for the period of January to April, up 1.8 percentage points year on year, the data showed.
"Coal demand, despite being relatively flat year on year, has been rising heading to the summer peak season," the note said.
It added that coal inventories at power plants remain ample and could continue to put pressure on thermal coal prices in the coming weeks.
Daily power consumption in China has been on the rise in recent days from around 550,000 mt last week to around 619,000 mt Thursday due to warmer weather.
Stockpiles at major power utilities were reported to be around 16.32 million mt, enough to last for around 26 days of burn, according to China-based market sources.
S&P Global Platts assessed the most liquid Indonesian 4,200 kcal/kg NAR grade of coal at $39.10/mt FOB Kalimantan on Wednesday, down from $39.45/mt FOB on May 2.
The weakening of demand comes as the Chinese Yuan softens against the US dollar amid the ongoing US-China trade dispute.
April raw coal output growth slowed to only 0.1% year on year, with weaker growth compared with March, as intense mining safety checks likely weighed on domestic production, Citi noted.


