


The latest Drilling Productivity Report from the EIA, released yesterday (February 13, 2017), shows that while the combined rig count in the seven major U.S. shale plays rose about 25% in the fourth quarter of 2016 versus the previous quarter, and the number of wells drilled was up 29%, well completions were up a paltry 1%, leading to an increase in the inventory of drilled-but-uncompleted wells (DUCs). Completions accelerated a bit in January 2017, but DUCs still continued to rise. That certainly seems counterintuitive. With crude oil prices stable in the low $50’s over the past few months you might think that producers would be pulling DUCs out of inventory, and in fact there have been statements to that effect in several producer investor calls. This is not just an exercise in energy fundamentals numerology. If the DUC inventory is increasing, then production will not be ramping up as fast as the growing rig count would imply. But what if, as some early signs indicate, the historical relationships are out of whack and the DUC inventory isn’t growing but rather declining? In that case, forecast models could be understating the outlook for production growth, and the market could be in for a more rapid and steeper rebound in oil and gas production than many expect. In today’s blog, we delve into the DUC inventory data and its potential upside risk to production forecasts.
Two years ago, the U.S. oil and gas market and its industry analysts were on high alert for the first signs of declining oil and natural gas supply as oil prices collapsed and rig counts plunged. Now, in recent months, spot oil prices have turned more supportive, rig counts have climbed and many industry models are trained on identifying the opposite trend—the trajectory of rising production in 2017. Predicting how quickly production will ramp up, however, is a tricky business in that it requires knowing not only how prolific producers are in drilling and completing wells but also how producers are using their existing inventory of drilled-but-uncompleted wells (DUCs) to pace production volumes. The EIA, the industry benchmark for tracking production, has in recent years developed a robust methodology for going beyond the rig count to estimate and forecast production. It does so by accounting not only for decline rates of existing wells but also efficiency gains demonstrated by new drilling activity for each of the seven major U.S. shale plays (see Every Rig You Take). And more recently, the EIA added another key dataset: the estimated inventory of DUCs for each of the seven plays, including the number of wells drilled versus completed each month since December 2013 (see DUC, DUC Produce).
Understanding the DUC inventory trend is critical to forecasting production because it reflects the ability of producers to respond in relatively short order to market fundamentals such as price and demand without a single rig addition. As we noted in “DUC, DUC Produce,” at any given time, there is always a substantial base inventory of DUCs in the market due to the normal delay between drilling and completion activities. But increases or decreases in the DUC inventory can speed or slow the rate of production growth (or decline) in the short- or mid-term. When crude oil prices crashed in 2014 through early 2016, we saw an increase in DUCs as producers continued to drill, but deferred completing wells due to economics, contractual commitments and other factors. It was generally expected that as prices increased, many producers would start competing those previously drilled wells (i.e., taking DUCs out of inventory) to start generating cash from their drilling investment. But as shown in Figure 1, (according to EIA’s DUC inventory and Drilling Productivity Report data) that was not the case, particularly in the most prolific of plays – the Permian. Since June 2016, more than 500 DUCs have been added to inventory, far out of proportion to the increase in the total Permian rig count.
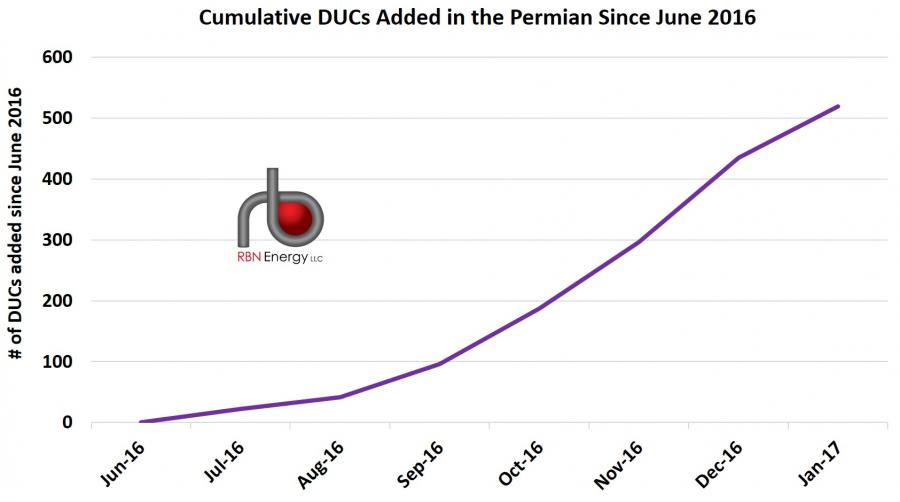
Figure 1; Source: EIA Drilling Productivity Report
As rigs and drilling activity have been slower to return to the other shale regions, the DUC inventories in nearly all of the other shale regions are gradually declining. The only other exception to that besides Permian is the Niobrara, which has seen a slight uptick in DUCs. But the DUC additions in the Permian along have far outweighed any declines in the other regions. Figure 2 below summarizes the net rig and wells counts for all seven major U.S. shale plays covered in the Drilling Productivity Report (DPR): Bakken, Eagle Ford, Haynesville, Marcellus, Niobrara, Permian and Utica. Overall, as rigs were added over the past several months across all the regions, producers were drilling wells at a much faster pace than they were completing them, resulting in a net increase in the inventory of DUC wells. That’s a shift from earlier in 2016, when overall well completions were exceeding drilled wells, and the total U.S. shale DUC inventory was being worked off.
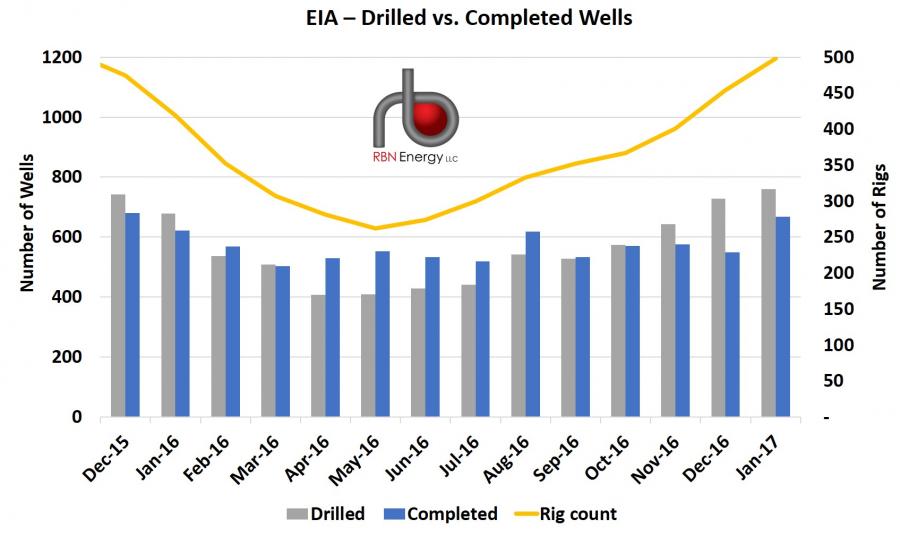
Figure 2; Source: EIA Drilling Productivity Report
From third quarter 2016 to fourth quarter 2016, the total rig count across the DPR’s seven shale regions (yellow line in Figure 1) rose by 79 (24%) to an average of about 400 rigs. As of January 2017, the rig count was up another 91 (22%) to 498. More than half of these were added in the Permian alone. As you would expect from the rig additions, the total number of wells drilled across the shale regions (gray bars) also rose substantially in the EIA data, up about 430 (29%) from about 1,500 in third quarter of 2016 to about 1,950 in fourth quarter 2016. But of those drilled wells, EIA estimates that fewer and fewer were being completed to production. Thus, the number of wells completed (blue bars) rose considerably slower over that period, up a meager 23 (1%) to about 1,700 in fourth quarter 2016, from about 1,675 in third quarter of 2016. The resulting increase in the DUC inventory (1,950 drilled minus 1,700 completed) was about 250 (5%) from third to fourth quarter of 2016,
The latest EIA report added January 2017 estimates, which show that the proportion of drilled to completion wells improved last month but that the DUC inventory continued to grow. In January, EIA estimates that 760 wells were drilled, up 32 (4%) from 728 in December 2016, and completions rose by 119 (22%) from 549 to 668 quarter-on-quarter, effectively increasing the DUC inventory by 92 wells (760 drilled minus 668 completed) to a total of 5,381 DUCs across the shale regions.